Menu
  • Über uns
    • Unternehmen
    • Team
    • Karriere
    • Referenzen
    • Partner
    • Kontakt
  • Produkte
    • Versiegelungserfassung
    • Baumerfassung aus Luftbildern
    • Erdbeobachtungsmetadatenoptimierer
    • Monitoring von Landnutzungsveränderungen
    • Temperaturdaten
    • LST-Daten Client
    • Schulungen
  • Services
    • actinia – Geoprozessierung in der Cloud
    • Analyse von raumbezogenen Daten und Erdbeobachtungsdaten
    • CORONA Spionagesatellitendaten
    • maps.mundialis
    • Web Kartendienste
    • GIS Entwicklung
    • Open Source GIS
  • Märkte
    • Fernerkundung für die Landwirtschaft
    • Satellitenbilder für die Wiederherstellung von Wald- und Bodenbedeckung
    • Glasfaser-Trassenplanung – FTTH
    • Copernicus und Sentinel
  • News & Blog
    • News
    • Blog
    • Satellitenbild des Monats
  • English English
  • Deutsch Deutsch

HERMOSA Feature-of-the-Week: Keeping an eye on progress using the module “Monitor & Report”


1. April 2021 | Category General

Once an ecosystem restoration or protection project is underway, at least all partners but also many other stakeholders are wondering: “How is the project doing?” This very general question can be broken down into numerous other questions, like “which percentage of the project area has already been planted?”, “what is the impact of the project on the community”, “will milestones agreed upon with the donors be met?” and so on.

This is where the module “Monitor & Report” comes into play. HERMOSA has automated access to the Sentinel archives of the Copernicus Programme where data which might only be a day old is available for download and analysis. Questions related to the status of the project can easily be answered by requesting Earth observation data for the time and area in question by simply drawing a bounding box on the map and providing a start and an end date. Since the satellites continuously observe the landmass a new dataset for any spot on Earth gets generated every one to two weeks, allowing for incredibly detailed time series. The different satellite sensors provide data products which have a high resolution of 10 to 20 meters. Sometimes however, this spatial resolution is not sufficient, for example when working with small-holder farmers who typically work on plots of less than an hectare. For this case HERMOSA has automated access to satellite image archives of commercial vendors who can provide data with a spatial resolution down to 0.5 meters.

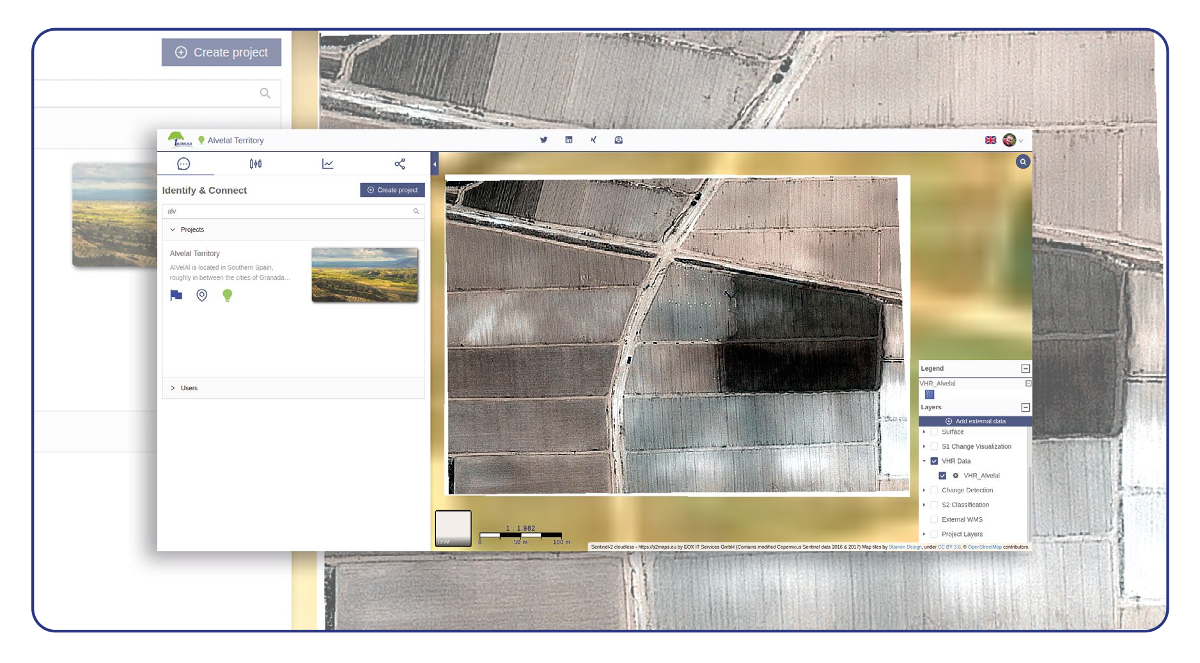
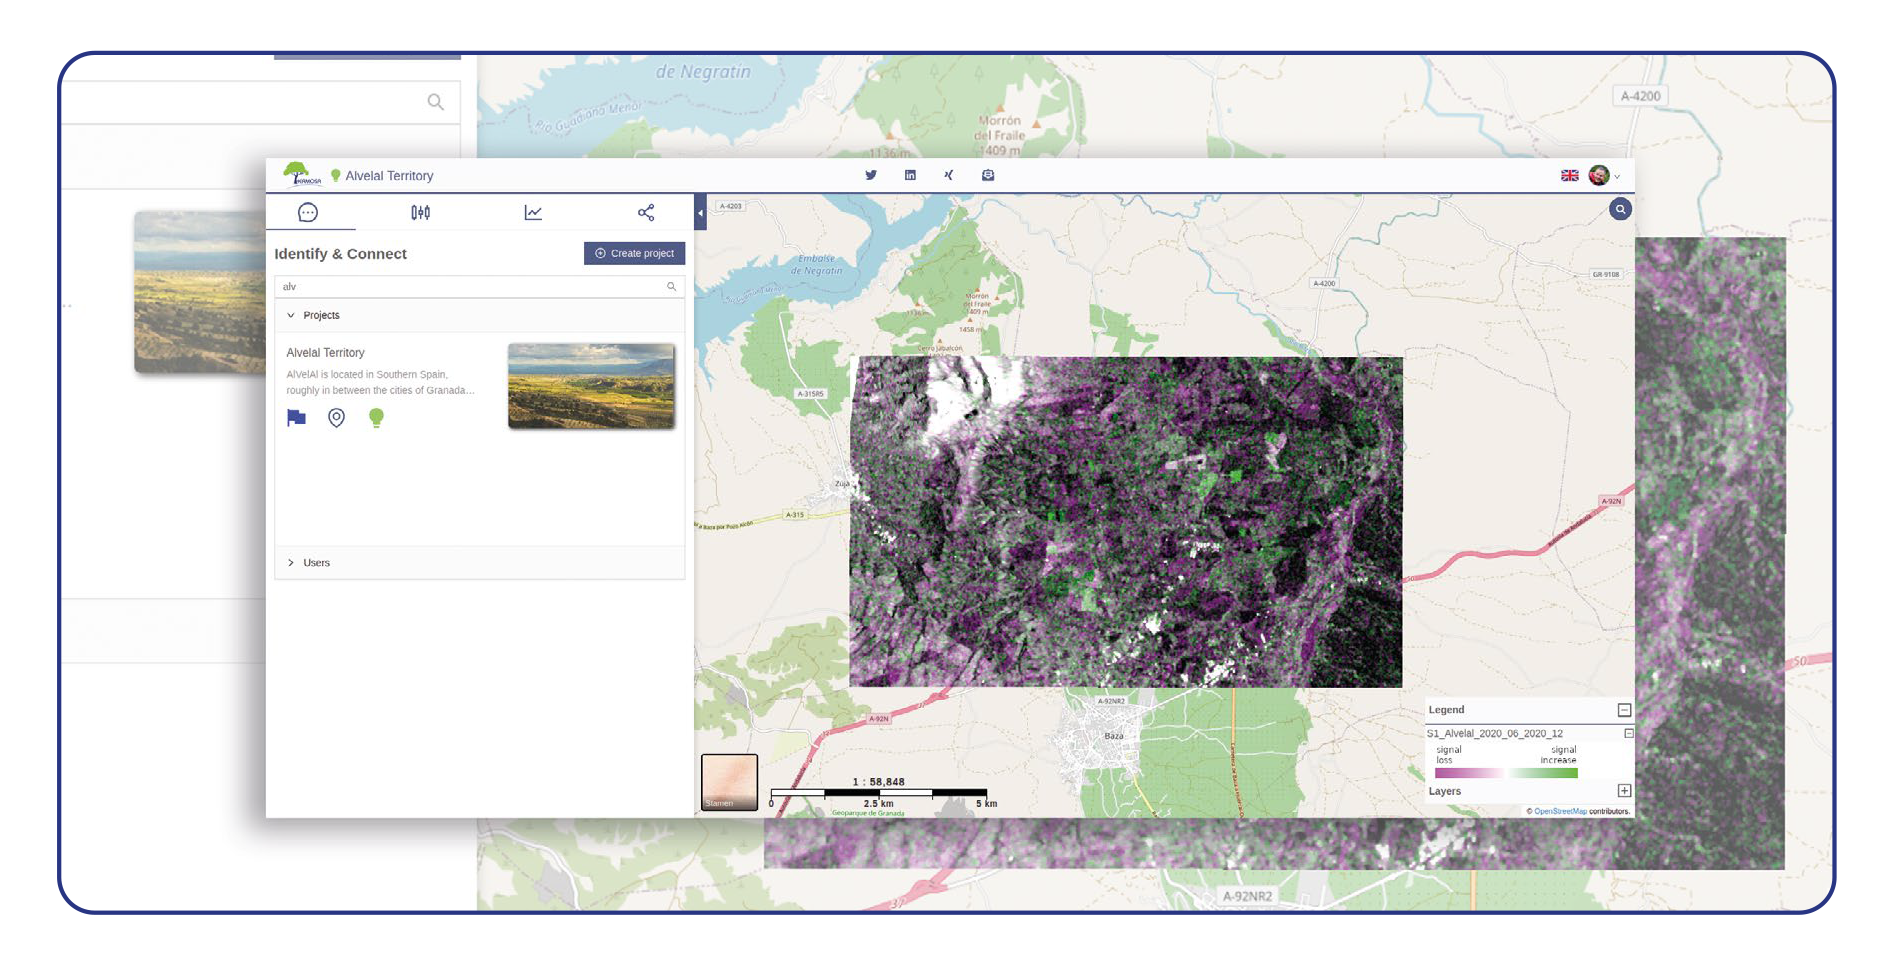
Since the sensors on the satellites have multiple spectral bands they can be analysed with regard to, for example, vegetation vitality, land use and land cover, something that drone data usually can not do. When you have processed data for two different points in time you can subtract the younger map from the older map and visualise the change in time. And you can access this kind of data from the comfort of your office without having to go out into the field. Tried and tested methods will turn the satellite data into maps including geostatistics which are then made available in HERMOSA.

As data is being dynamically processed to quantify project progress in a transparent way the need to utilize this data in reports arises. Well, you have probably already guessed that this is another feature of HERMOSA. Answers you derive for your central questions can be exported to PDF; these can include the geo-data, statistics, plots and a lot more. Obviously you can share this document digitally or even print it on paper.

Contact sales@hermosa.earth today to get started!

reposted from https://hermosa.mundialis.de/news/feature-of-the-week-kw-13/

Comments are currently closed.

Folgen Sie uns hier

Kontakt

mundialis GmbH & Co. KG
Kölnstrasse 99
53111 Bonn

Telefon: +49 (0)228 / 387 580 80
Fax: +49 (0)228 / 962 899 57

E-Mail: info [at] mundialis [dot] de

Letzte Beiträge

  • MOOD Scientific Conference und General Assembly

    Dienstag, der 25. Juli 2023
  • 🌲 🌳 🌴 Automatisierte Einzelbaumerkennung aus Luftbildern 🌲 🌳 🌴

    Donnerstag, der 20. Juli 2023
  • GRASSGIS feiert 40 Jahre!

    Donnerstag, der 22. Juni 2023
  • mundialis bietet Mitarbeitern Jobräder an

    Dienstag, der 13. Juni 2023
  • Abschluss des Projektes FAIR

    Mittwoch, der 19. April 2023
Alle Beiträge ansehen

Blog

  • Satellitenbild des Monats – September – Noord-Holland (Niederlande) 5. September 2023
    Noord-Holland – Niederlande – aufgenommen vom Sentinel-2A Satelliten am 14.06.2023 Unser ...
  • Satellitenbild des Monats – August – Salar de Uyuni (Bolivien) 8. August 2023
    Salar de Uyuni – Bolivien, aufgenommen vom Sentinel-2B Satelliten am ...
  • Satellitenbild des Monats – Juli – Helsinki (Finnland) 4. Juli 2023
    Helsinki – Finnland, aufgenommen vom Sentinel-2A Satelliten am 23.06.2023 Auf unserem ...
Alle Blog-Beiträge ansehen

Copyright © 2015-2023 mundialis GmbH & Co. KG

Impressum Datenschutzerklärung

Theme created by PWT. Powered by WordPress.org