Während der Arbeit an einem Projekt, bei dem es um das Prozessieren und Hochladen von Rasterdateien in GeoServer ging, kamen mehrere Herausforderungen auf uns zu. Die Änderung der Farbtabelle (color table) zur optimierten Ansicht war eine davon.
Geospatial Data Abstraction Library (GDAL)
Die freie Programmbibliothek GDAL bietet für diese Problemstellung ein nützliches Programm, welches mit Hilfe von Farbtabellen das Aussehen der Raster-Dateien ändern kann. Es heißt gdaldem color-relief und wurde eigentlich konzipiert, um den Farbverlauf von digitalen Geländemodellen darzustellen Es kann jedoch auch benutzt werden, um die allgemeine Erscheinung von Raster-Karten zu ändern. Die Syntax lautet:
gdaldem color-relief inputfile color_table.txt outputfile
Um jedoch die Farbtabelle einer Karte zu verändern, muss diese erst ausgelesen werden. Die Funktion gdalinfo kann in Bash benutzt werden, um die Farbtabelle und viele weitere Parameter aus Rasterdateien aufzulisten. Die Farbtabelle kann jedoch nicht auf einfache Weise gespeichert werden, um sie später sinnvoll zu benutzen.
GDAL Funktionen in Python
Mit den GDAL Funktionen für Python kann genau diese Problemstellung präzise gelöst und die Farbtabelle als Text-Datei gespeichert werden. Der Befehl GetRasterBand() liest Infos des ersten Bands aus, welches beispielsweise den Typ Palette hat. Der Befehl band.GetRasterColorTable() liest die Farbtabelle des Bands aus, welche in unserem Beispiel 8 Bit hat, also aus 256 RGB-Einträgen besteht. Nun muss nur noch eine Text-Datei erstellt werden. In dieser wird der jeweilige Eintrag von 0-255 (i) und der dazugehörige RGB-Farbwert (sEntry) eingetragen:
fn   = gdal.Open(filename)
band = fn.GetRasterBand(1)
ct   = band.GetRasterColorTable()
f    = open("rgb_color.txt", 'w+')
       for i in range(ct.GetCount()):
          sEntry = ct.GetColorEntry(i)
          f.write( "  %3d: %d,%d,%d\n" % ( \
              i, \
              sEntry[0],\
              sEntry[1],\
              sEntry[2]))
Farbtabelle
Die “rgb-color.txt”-Datei hat hier dementsprechend 256 RGB-Einträge mit Farbwerten von 0-255 und sieht zum Beispiel so aus:
    0: 255,255,255
    1: 153,255,179
    2: 230,255,204
    3: 191,242,128
    4: 230,230,204
    […]
    255: 255,255,255
Der nullte Wert entspricht dabei in unserem Beispiel der Farbe Weiß, der erste Wert Minz-Grün und der zweite Creme. Eine Internetseite ist hier zu finden, um unkompliziert die RGB-Werte in Farbnamen zu übertragen.
Das sed Werkzeug
Das Programm sed ist ein weiteres nützliches Werkzeug in Bash. Es kann Strings, Integers und Text-Dateien verändern. Um die Farben in den Raster-Dateien zu editieren, muss zuerst der neue Wert eingetragen werden und danach der zu ersetzende Wert. Als Trennzeichen wird in unserem Beispiel ein Doppelpunkt benutzt. Wenn man in einem simplen Beispiel die Farbe Schwarz zu Weiß ändern möchte, muss man daher 255,255,255:000,000,000 schreiben:
sed -i -e "s:255,255,255:000,000,000:g" rgb_color.txt
Um mehr als nur eine Farbe zu ändern lohnt sich der Einsatz einer for-Schleife. Die neuen Farben müssen in der gleichen Syntax wie oben in einer Variable gespeichert werden, hier z.B. rgb_list. Der eigentliche sed Befehl wird dann von der for Schleife umschlossen und erledigt seinen Dienst:
rgb_list="191,242,128:034,139,034 255,153,179:255,000,000"
for i in  ${rgb_list}; do
   sed -i -e "s:${i}:g" rgb_color.txt
done
Abschließend muss nur noch der oben genannte Befehl gdaldem benutzt werden, um mit Hilfe unserer RGB-Text-Datei die Raster-Karte zu ändern. Um Speicherplatz zu sparen, kann diese dann als virtuelle Datei (VRT) gespeichert werden:
gdaldem color-relief -of VRT input.tif rgb_color.txt rgb_output.vrt
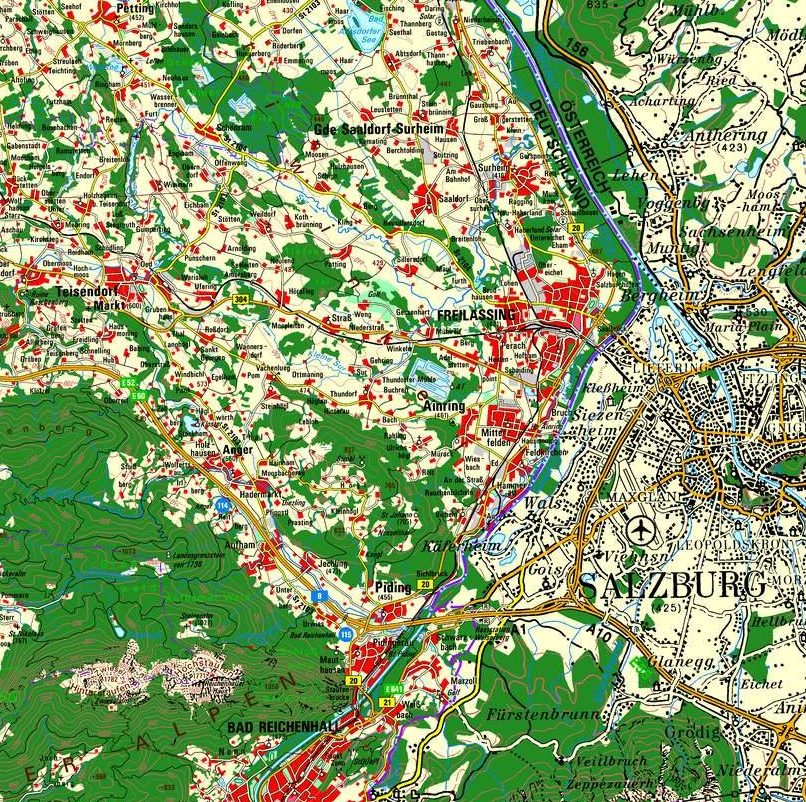
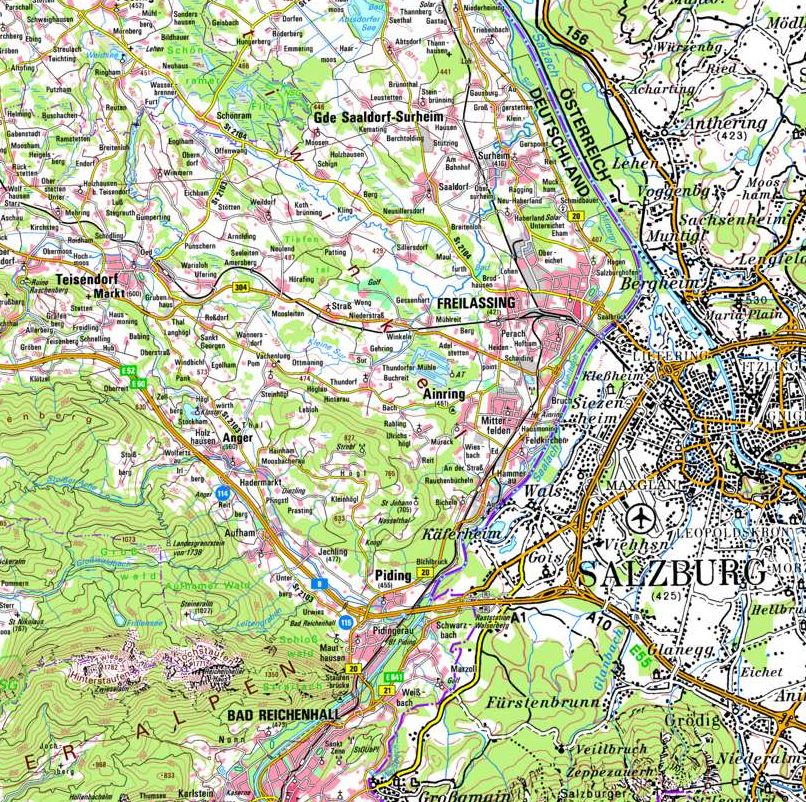
Beispiel: Anwendung an einer digitalen topographischen Karte
Der Kartenausschnitt zeigt die Grenzregion zwischen Deutschland und Österreich in der Nähe von Salzburg. Die ursprüngliche digitale topographische Karte im Maßstab 1:100.000 (DTK100) ist auf der linken Seite zu sehen. Die rechter Hand davon gezeigte neue Karte hat die veränderten Farben implementiert. Wälder werden hier mit einem dunklerem Grün (034,139,034) angezeigt als zuvor (191.242,128). Rot (255,000,000) symbolisiert nun Siedlungen, im Gegensatz zu dem Pink (255,153,179) des Originals.
Das dazugehörige Skript kann auf GitHub eingesehen werden und steht frei zur Verfügung.