
The HERMOSA platform relies on the successful Copernicus satellite programme operated by the European Commission and managed by the European Space Agency (ESA). The unique and thrilling aspects of these sensors called Sentinels are the high temporal and spatial resolution of the data they produce plus the fact that all of it is made available for free to everyone. Started in 2014 more and more satellites have been launched into orbit over the years and more will be added in the future completing the fleet by the end of third decade of the 21 st century. Commonly, there are two satellites with identical sensors, while overall the sensor types cater to different needs.
 There are a variety of sensors flying on the satellites but today we will focus on the type that uses a multispectral camera taking pictures in the spectrum of light some of which is also visible to humans. Provided that no clouds are in the way the pictures will depict the surface of the Earth with its forests, fields, towns, roads, rivers, lakes and other phenomena. The spatial resolution of 10 meters means that each square pixel is 10 x 10 meters in size, which is very impressive, also with regard to data volume, considering the fact that the whole landmass of Earth is being photographed frequently. Here, the interesting feature is the revisit time or temporal resolution. Each satellite passes over the same spot every 10 days but since there is a constellation of 2 satellites the revisit time is reduced to 5 days. During the course of a year up to 73 new datasets are created for each land parcel. Since not all images in a year are cloud-free the usable number is of course smaller.
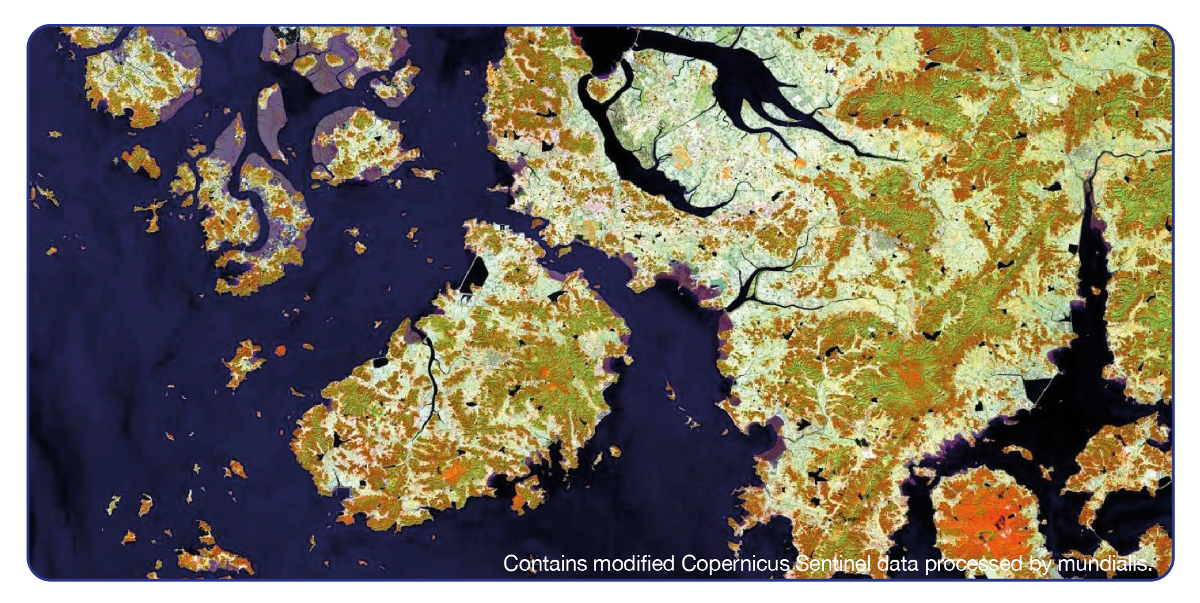
The pixels in the satellite images can be classified according to the land use they represent, i. e. forest, grassland, agricultural area, bare soil which all show up differently in an image. The trick now is to do this automatically and not through human visual inspection, because this would be a very tedious and time consuming job. No person would like to do or could do this in a meaningful way for a large area, say a country. In the HERMOSA platform there are two ways to achieve this:
- The user marks areas in an image which correspond to a certain land use class. This data is deemed training data. A machine learning approach is then utilized to find pixels of the same colour and composition which are then classified according to the values of the training data.
- A global dataset of already classified land use classes is used as the training data and the machine learning approach is applied to these in order to yield a classified map.
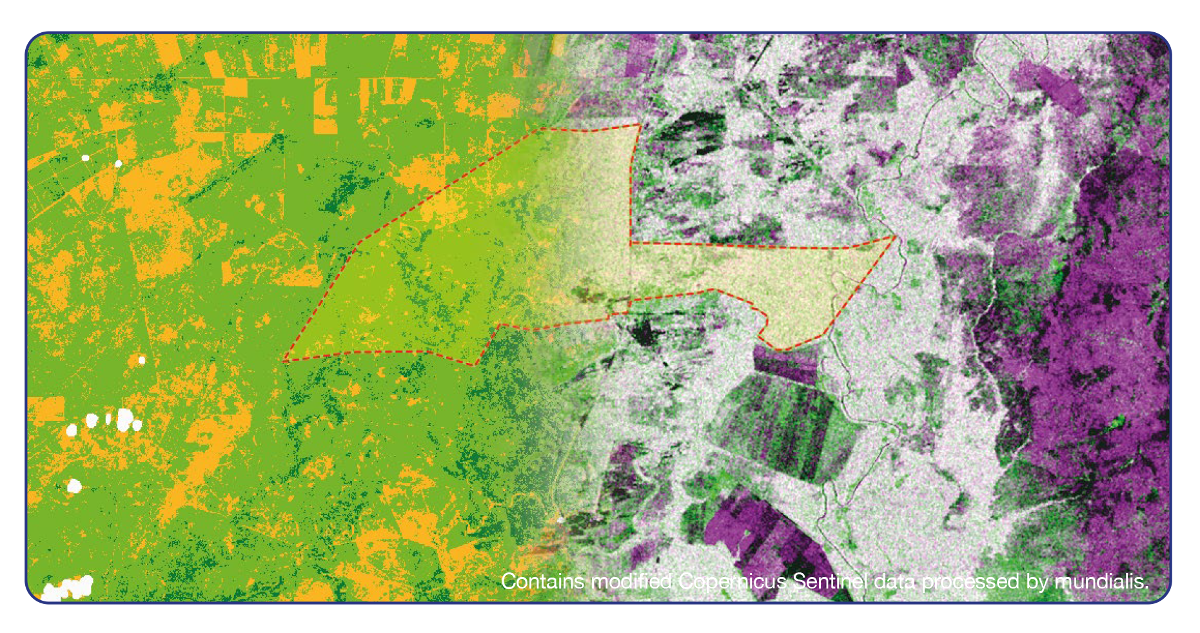
 In both cases the result is a land use class map which can be extracted from data that might only be a few days old. If you now take two land use class maps of the same area but from two different points in time there is the possibility to calculate so-called change maps, where the younger map is subtracted from the older map. If for example a forest area was detected in the older map which happened to be chopped down by the time the younger image was taken then subtracting these images would show the change in the area where the forest had been. And since all the data is geo-referenced one can even quantify the change in area also in comparison to other geodata.
Contact sales@hermosa.earth today to get started!
reposted from https://hermosa.mundialis.de/news/feature-of-the-week-kw-16/