We cover a wide range of geospatial and remote sensing data services. Our offer includes obtaining such data for your specific requirements. We understand not only the potential of this data, but also its limitations, so we can help you make the most of the resources available.
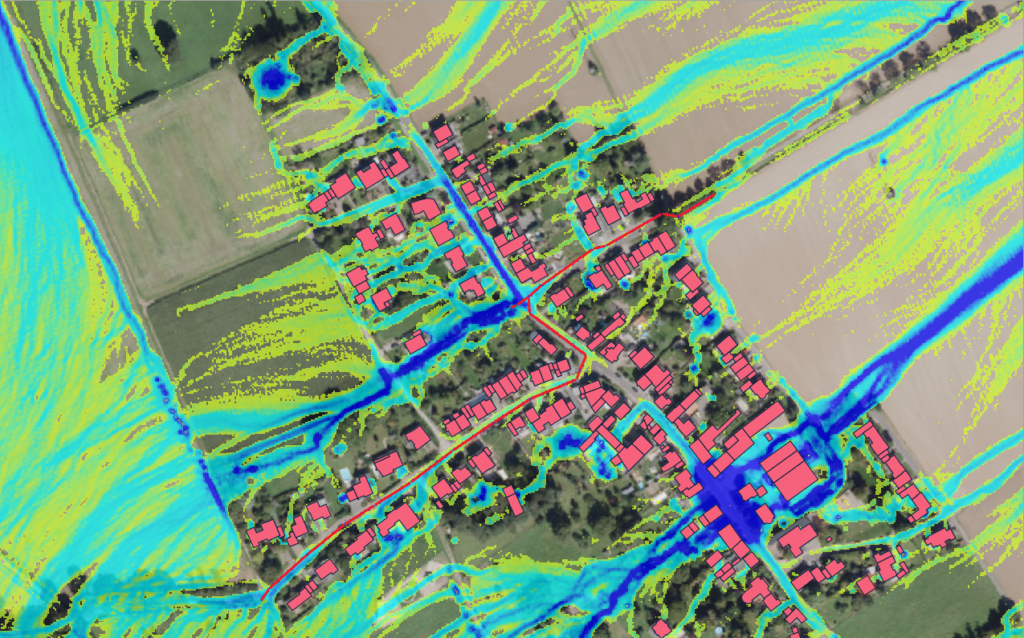
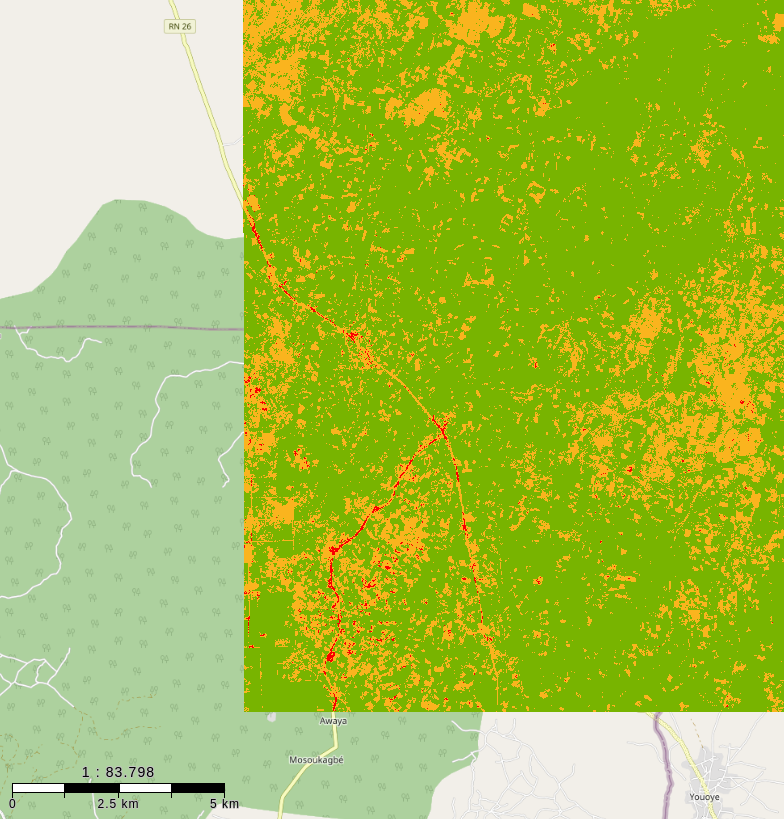
Our expertise also extends to land use classification, vegetation analysis, or damage assessment after natural disasters – we have the experience and know-how to assist you in these areas.
We support companies in the data management of their geodata. From organization, administration and storage to the development of geodatabases such as PostGIS and data visualization with GeoServer, we are your reliable partner in all aspects of geodata management.
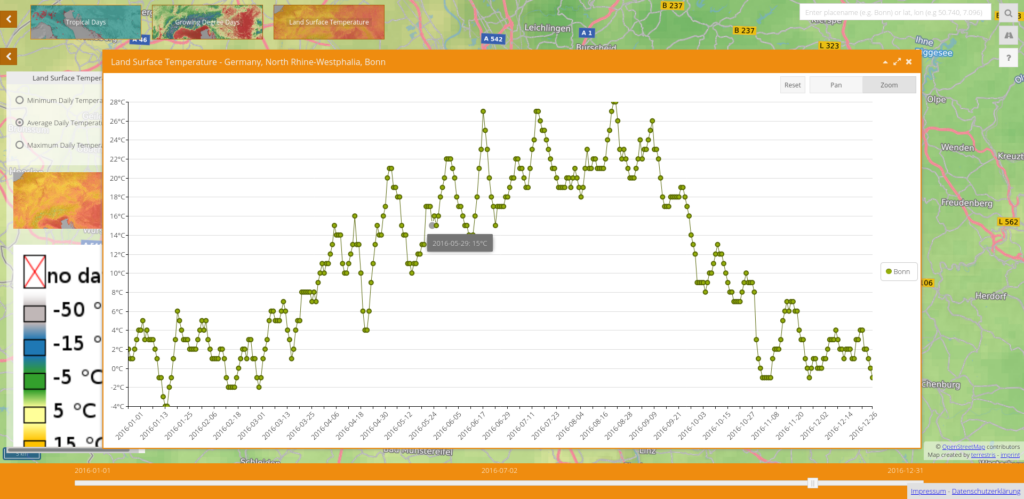
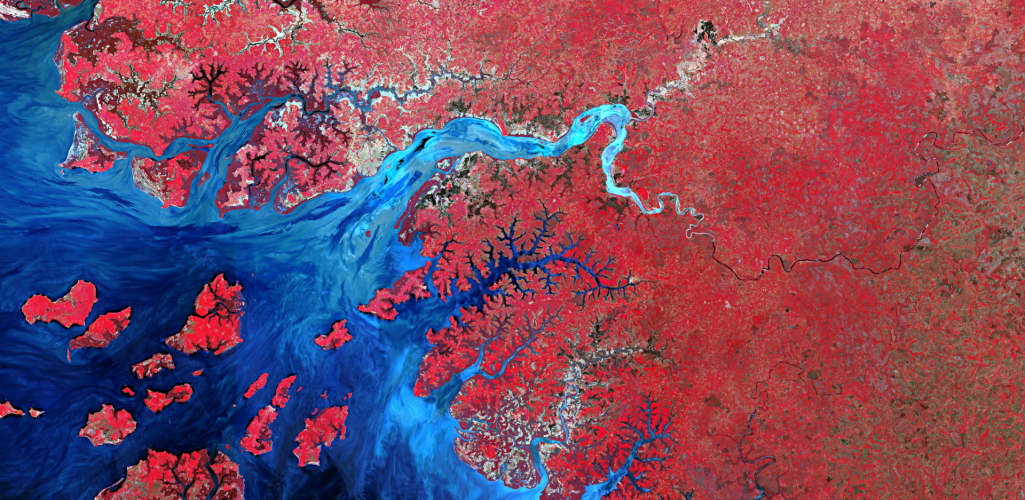
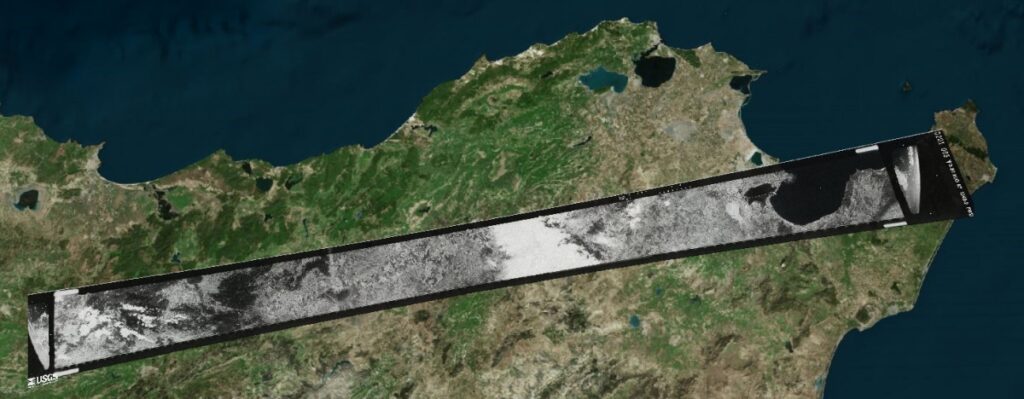
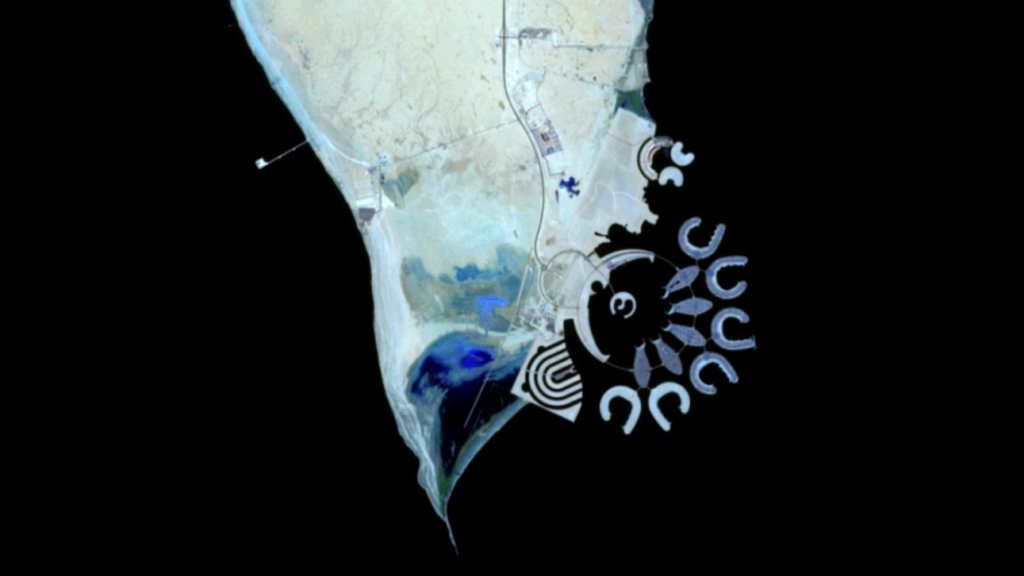
One of our focal points is the analysis of the Sentinel satellite data of the European Copernicus program. The time series of these satellites are processed in parallel and the results are offered as files or OGC Web Services. We add value through radiometric/geometric or atmospheric corrections, index calculation, image classifications and more.