The Sentinel-1 mission is part of the European Copernicus Programme and consists of several satellites for Earth observation. The satellites are equipped with a Synthetic Aperture Radar (SAR) instrument that can provide images of the Earth’s surface regardless of the time of day or weather conditions.
For our Sentinel-1 satellite images, we have Level-1 Ground Range Detected (GRD) data processed into Level-2 Backscatter (CARD-BS) via the Copernicus Data Space Ecosystem (CDSE). This provides us with analysis-ready data that contain two polarization bands, VV and VH, at a spatial resolution of 10 m. Polarization describes the direction of the electric field of a radar wave, which can be either vertically (V) or horizontally (H) polarized. VV means that the radar signal is transmitted vertically by the satellite sensor and also received vertically, while VH means that the signal is transmitted vertically but received horizontally. Depending on the structure of the surface, radar waves are scattered back differently, resulting in different backscatter signals in the respective polarizations.
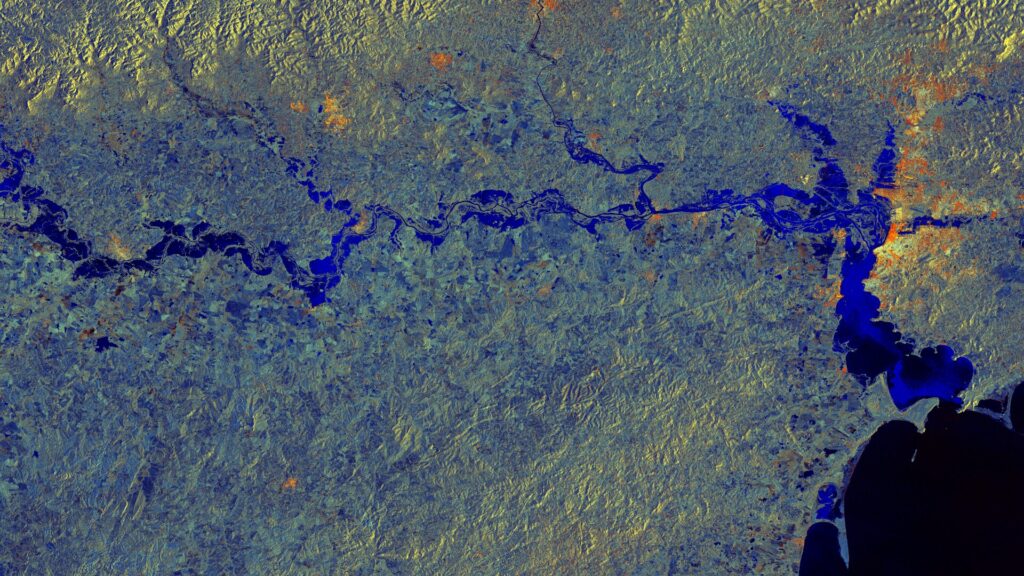
For our satellite image, we create an RGB composite from the two bands. The polarizations VV (red channel) and VH (green channel), as well as the ratio of VH to VV (blue channel), are assigned to the RGB color channels. This makes differences in radar backscatter from various surface types visible in color: cities typically appear in red and yellow tones, vegetation is shown in shades ranging from yellow and green to turquoise depending on its density, and water appears blue to black due to its very weak backscatter. In addition, compared to optical remote sensing data, the topography is much more clearly visible.