Our Satellite Images of the Month are based on data from the Sentinel-2 mission of the EU Copernicus programme. The mission began in 2015 with the launch of the first satellite, Sentinel-2A, and was expanded in 2017 and 2024 with the satellites Sentinel-2B and Sentinel-2C. By combining three satellites, a revisit rate of approximately 3 to 5 days is achieved, meaning that any location on Earth is overflown and imaged about every 3–5 days.
The multispectral sensors of the Sentinel-2 satellites record light reflected from the Earth’s surface in 13 spectral bands covering different wavelength ranges of the electromagnetic spectrum. Depending on the band, the spatial resolution of the images ranges from 10 to 60 metres.
Sentinel-2 data are freely available and can be accessed and downloaded via the Copernicus Data Space Ecosystem.
For our Satellite Images of the Month, we create various colour composites, each consisting of a combination of three spectral bands. We use the visible light bands red (4), green (3) and blue (2), as well as the two near-infrared bands (8 and 8A) and the shortwave infrared bands (11 and 12).
Processing is carried out using the free open-source software GRASS GIS. First, the spatial resolution of bands 8A, 11 and 12 is increased from 20 m to 10 m using a sharpening method and adapted to the other bands. For this purpose, a reference image derived from the 10 m data is created to enhance the 20 m bands to 10 m resolution. If multiple Sentinel-2 scenes are required for the final image extent, these are then mosaicked. Finally, the colour composites are calculated and exported.
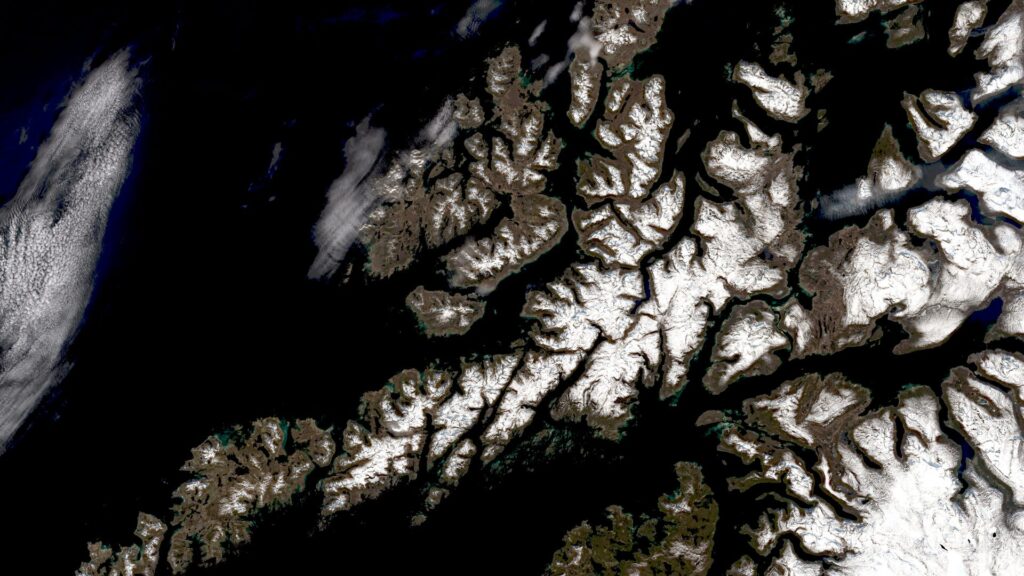
True-colour composite
A true-colour composite uses the three visible light bands—red, green and blue—so that the image appears in colours very close to human visual perception. Vegetation appears green, recently harvested fields very bright, soil yellowish-brown, and roads and buildings grey. Clouds and snow appear white and are not always easy to distinguish from one another. Different vegetation types, as well as shallow water and soil, are also difficult to differentiate in this representation. In addition, such images can sometimes appear hazy, as these wavelengths penetrate the atmosphere only to a limited extent.
False-colour composites
False-colour composites do not correspond to “natural” colours but allow different surface types to be distinguished more clearly. For our satellite images, we usually select one of the following false-colour representations.
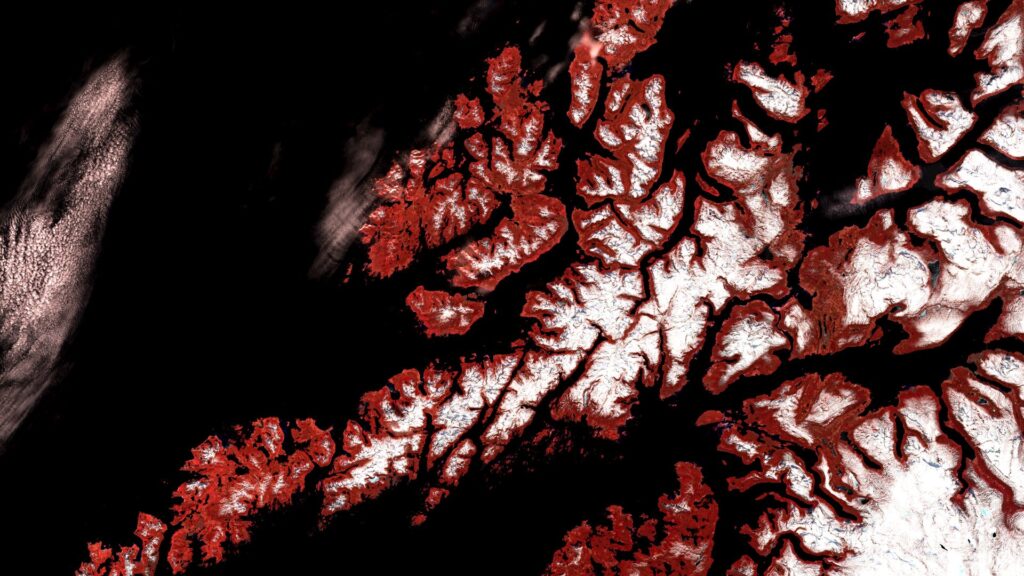
Colour Infrared
The colour-infrared representation (combination of near-infrared (band 8), red and green) is particularly well suited for identifying vegetation. Healthy vegetation appears in vivid red tones, while older vegetation appears more greenish. Soil is shown in brown and green tones, and urban areas in blue-grey. Clouds, snow and ice appear light turquoise to white.
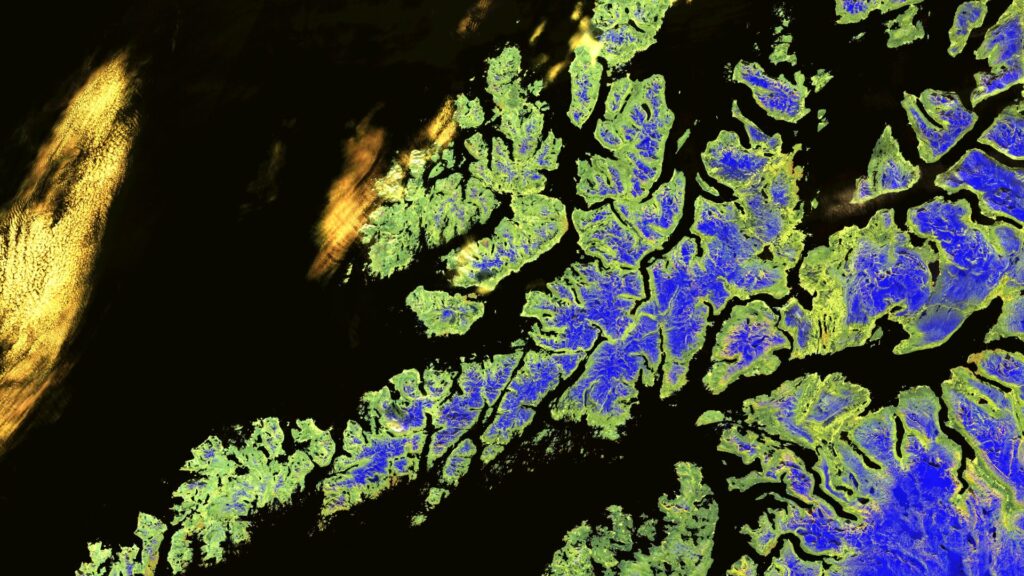
Land/Water: distinguishing land and water
The combination of bands 8A, 11 and 4 is especially useful for distinguishing between land and water surfaces. Healthy vegetation appears orange, older vegetation green. Soil and clouds appear in various shades of green, while water is shown in blue and violet tones. Ice appears in a striking magenta colour.
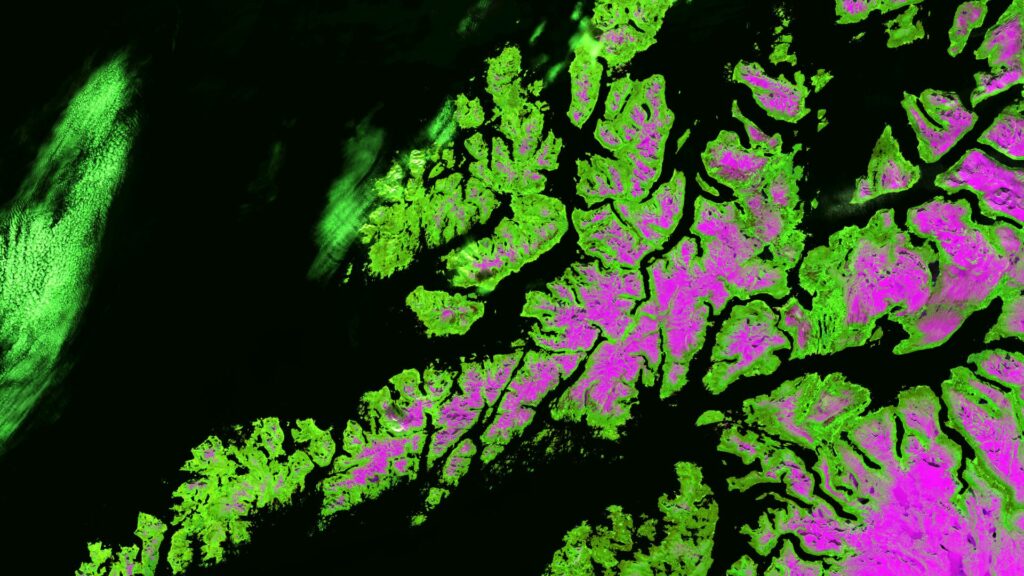
Vegetation analysis: focus on vegetation
Changing the band order to 11, 8A and 4 creates a representation that is particularly suitable for vegetation analysis. Healthy vegetation appears in bright green tones and can be very easily distinguished from soil, which ranges from pink (e.g. harvested fields) to vivid magenta (e.g. cleared rainforest). Clouds appear white, water dark blue to black, and ice a strong blue. Cities are shown in light grey to light pink.
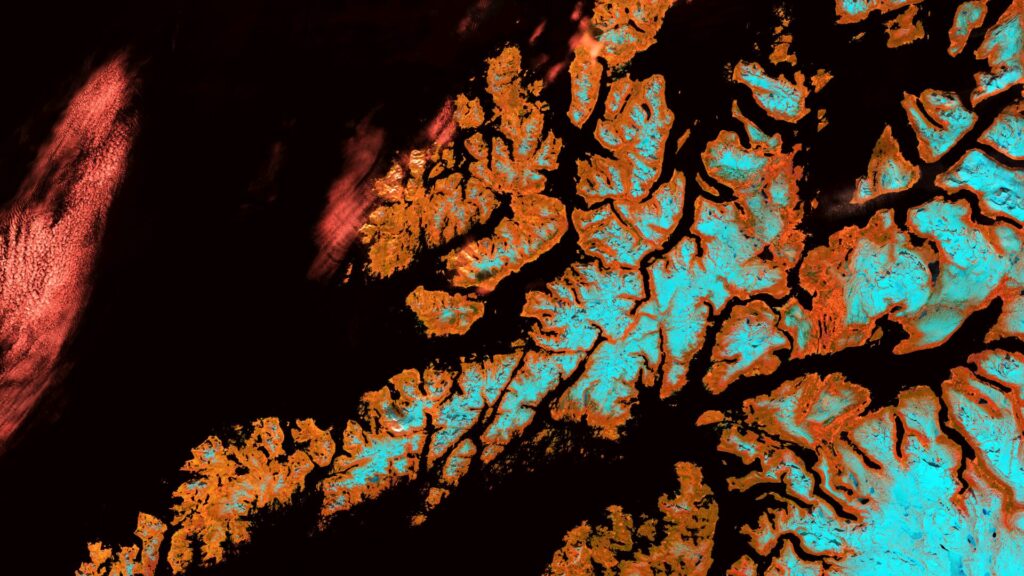
Atmospheric penetration
Another band combination used is 12, 11 and 8A. The two shortwave infrared bands (11 and 12) penetrate the atmosphere better than shorter wavelengths, making this representation particularly high in contrast and clarity. Water appears almost black, vegetation is shown in various shades of blue, and soil appears yellow.