
World in Transition — Signs, Traces, Solutions.
This year we invite you on a 12-part visual journey: from acute natural events to urban adaptation and on to long-term landscape change. Each image reveals not only a phenomenon but also the data techniques and analyses that make solutions possible — in the spirit of Earth. Data. Solutions.
Our first theme block, “Acute Hazards — Visible from Space,” focuses on natural hazards, their visible impacts, and potential analytical approaches.
Alberta — Canada, captured by the Sentinel-2B satellite on August 20, 2025 and August 25, 2025
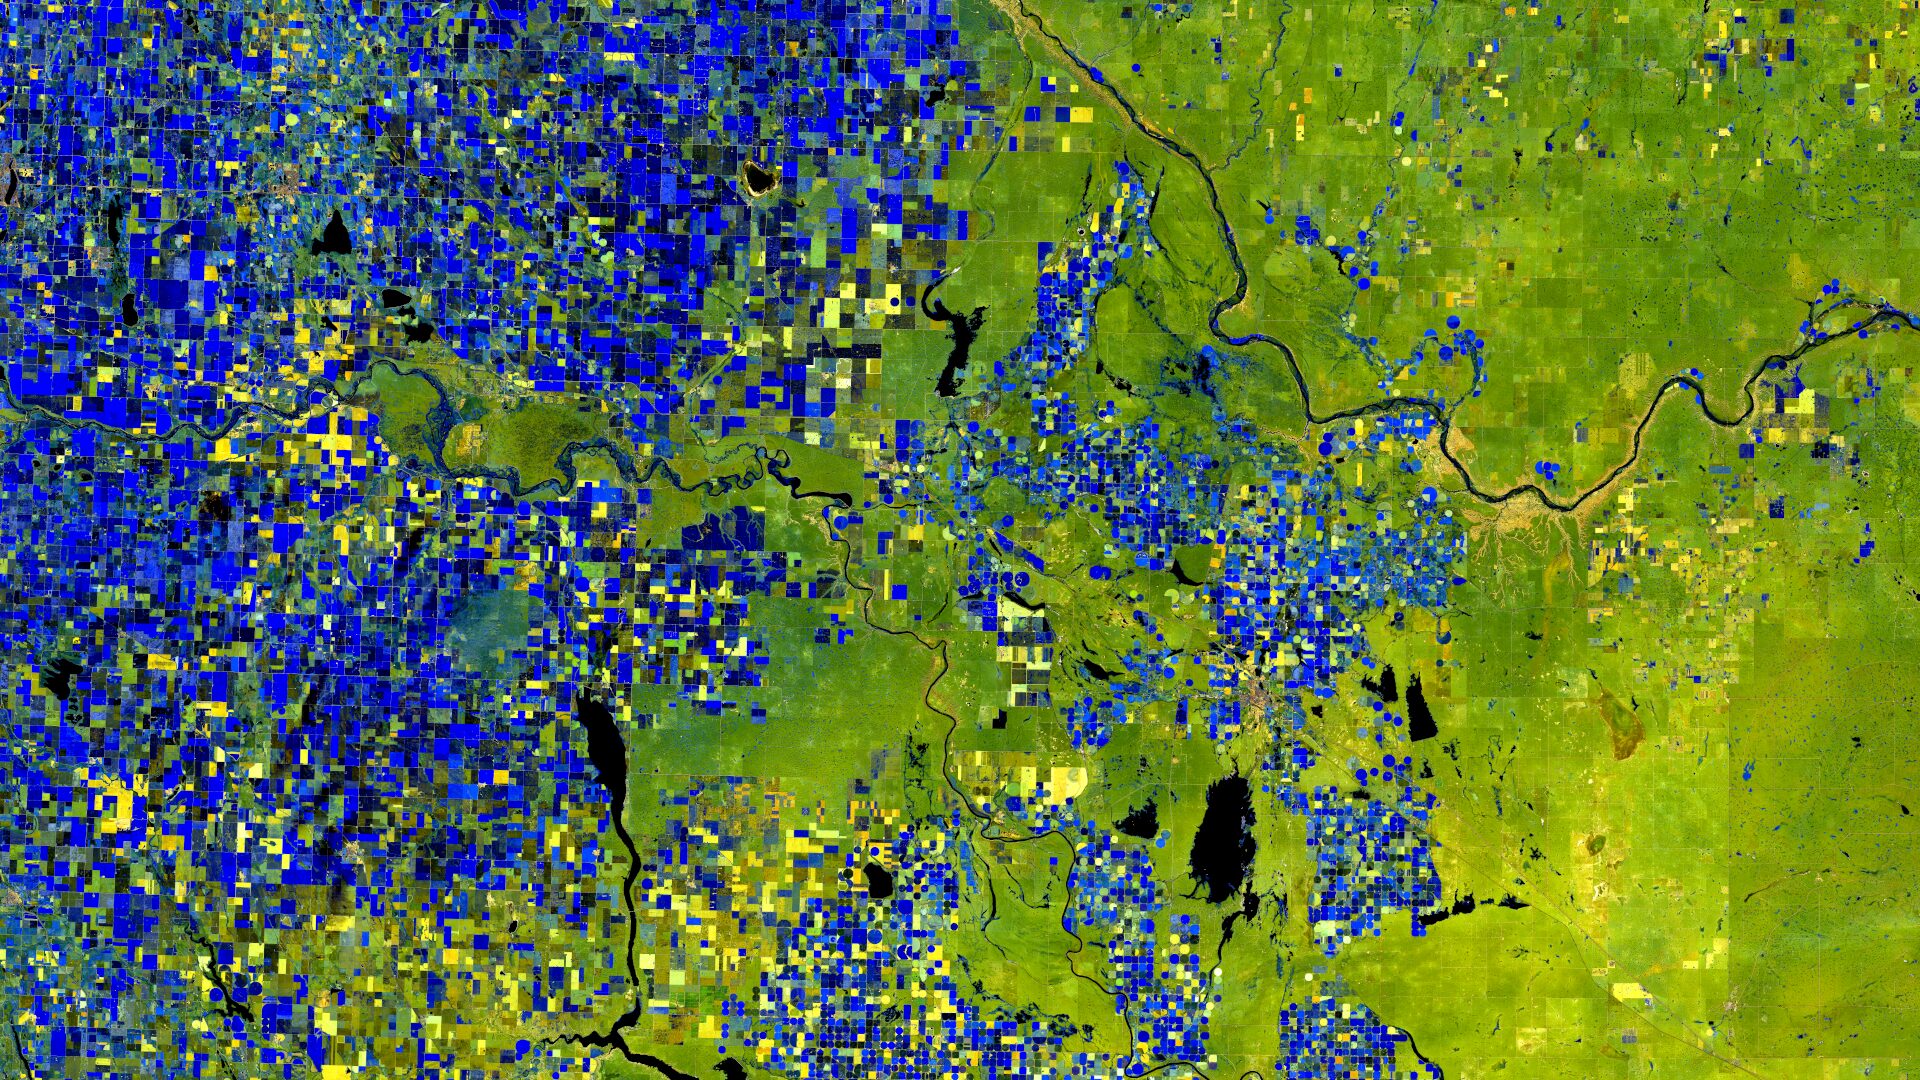
Our satellite image of the month shows a portion of the Canadian province of Alberta. Alberta is one of the three so-called prairie provinces (part of the Great Plains) and is located in western Canada. The image section shows a region southeast of Calgary, which is the province’s largest city by population.
For the creation of the images a false-color composite based on bands 12, 11 and 8A of the Sentinel-2B satellite was chosen. More detailed information on the satellite image processing can be found here.
Structure of the Image
In the western part of the images, large agricultural areas appear in blue and are mostly subdivided into the square parcels typical for the region. Also noticeable are circular features in the eastern and southern parts of the image; these are agricultural fields irrigated with center-pivot systems. The eastern half of the shown region is dominated by extensive steppe and grasslands (visible here in green and yellow tones) and is punctuated by small, irregularly shaped dark spots, which are mostly small lakes and ponds. The region is also traversed by two large rivers — the Bow River, which flows from the west toward the south, and the Red Deer River, which crosses the prairie from north to east.
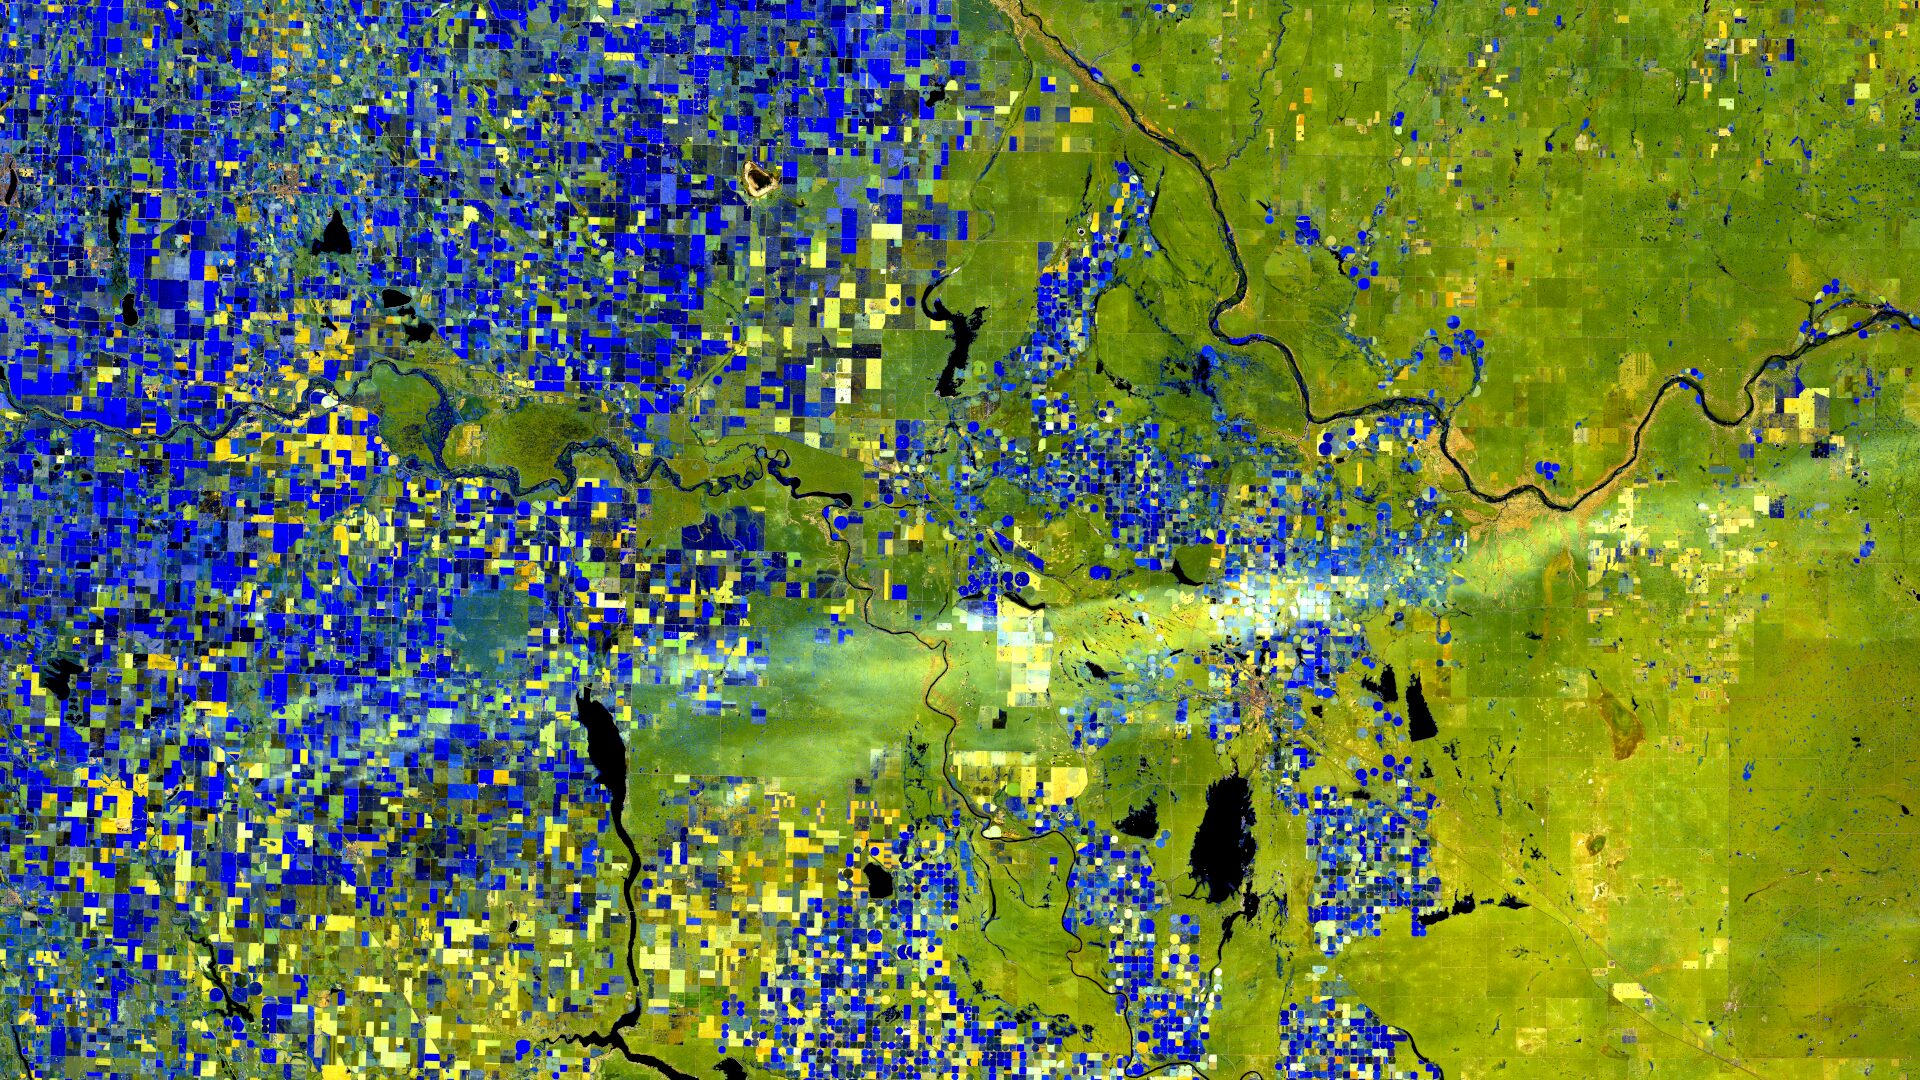
Severe Storm Event
On August 20, 2025 a powerful supercell crossed southern Alberta and left a corridor of severe damage up to about 15 km wide and 200 km long: gusts up to 165 km/h and hail up to 7 cm in diameter damaged vehicles, uprooted trees, downed power lines and destroyed numerous agricultural areas. A comparison of the two Sentinel-2 images clearly shows the storm-induced damage: a bright band, a so-called “hail scar,” runs from the southwest to the east across the prairie and over agricultural land.
Analysis Using Satellite Data
Satellite data makes it possible to analyse storm damage by comparing before/after images and time series: multispectral sensors (e.g., Sentinel-2) provide vegetation indices such as NDVI, whose differences make damaged areas (e.g., hail scars, windthrow in forests) highly visible. We at mundialis have extensive experience in the rapid processing of such geodata in the context of environmental monitoring. For example, within our forest monitoring product we can detect changes in forest stands caused by storm events and thus deliver essential data and information for a wide range of users. Further information can be found here or in our related webinar on the topic.
A different view of the region
The following animation shows an overlay with OSM data. The map visualisations were created using the terrestris OpenStreetMap Premium service.
Contains modified Copernicus Sentinel data (2025)/ESA – created by mundialis
Satellite images for your wall are available at https://art-from-space.de