
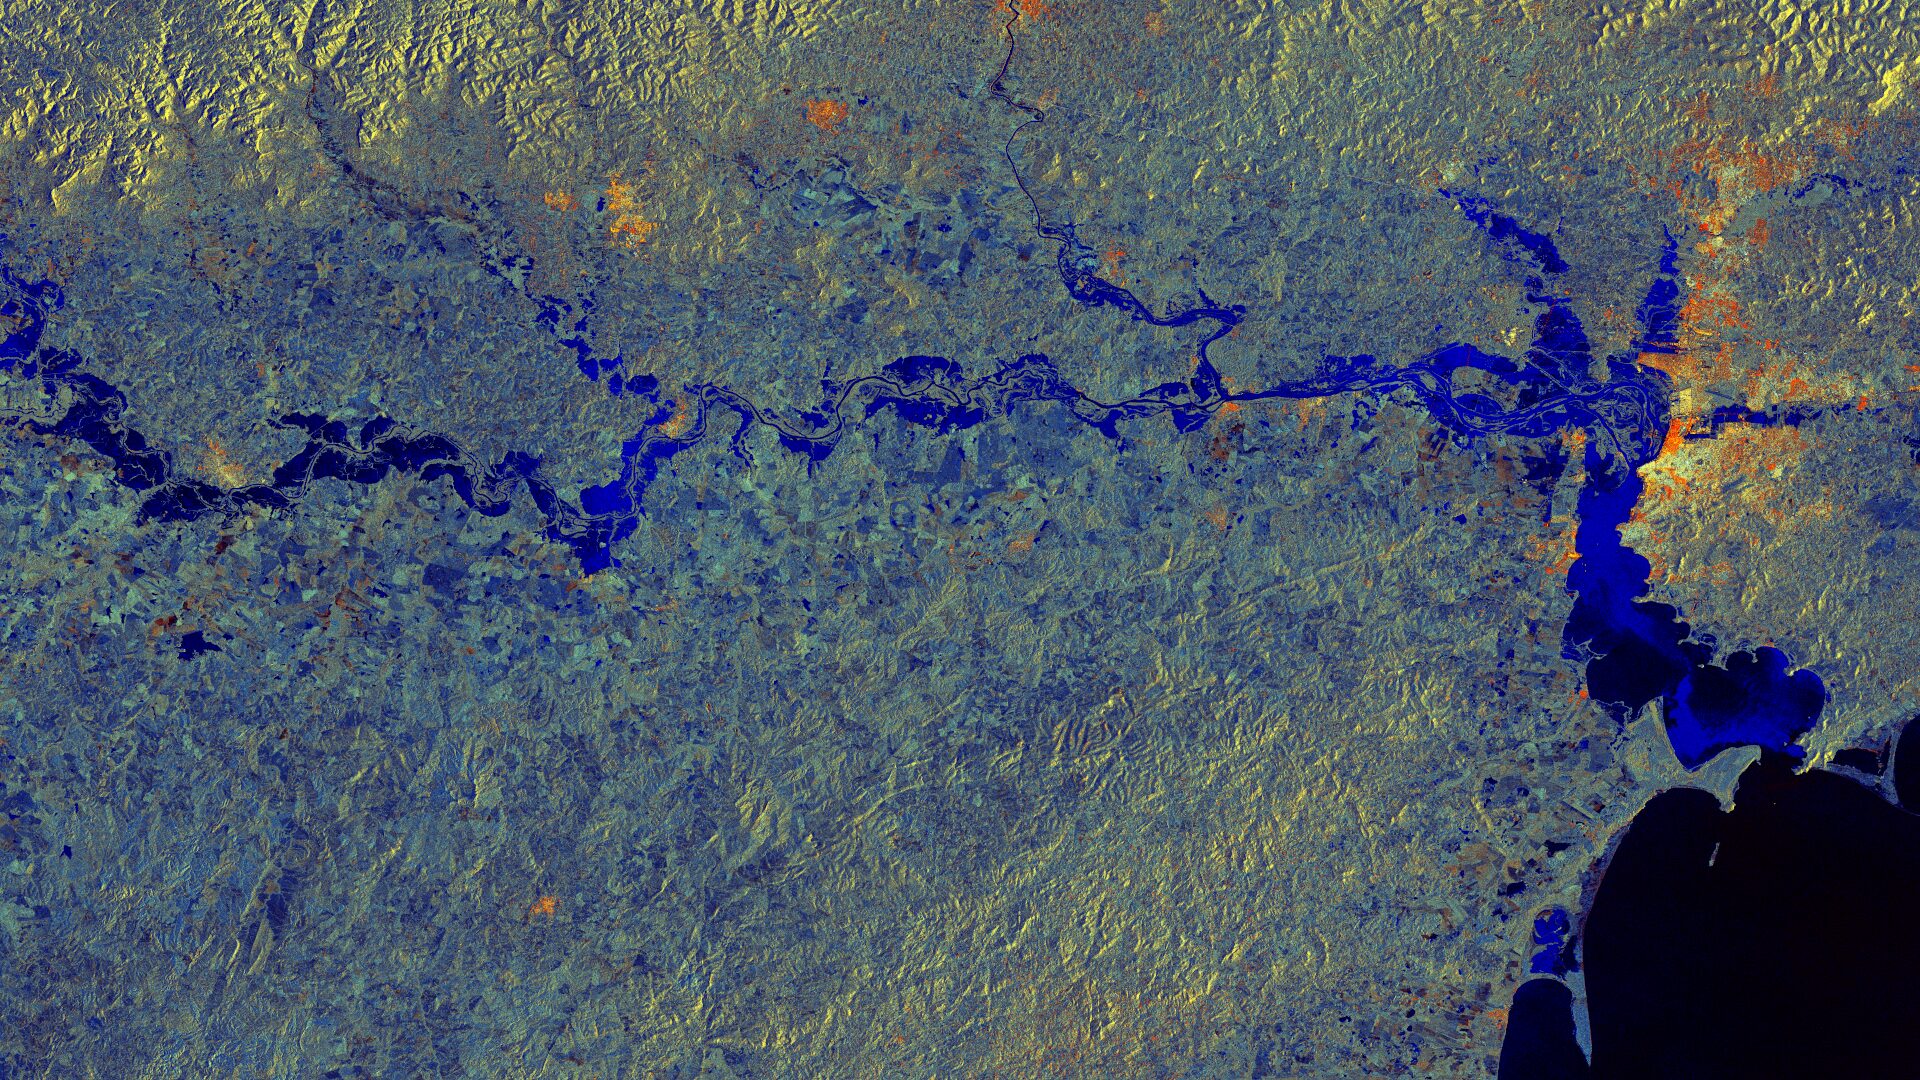
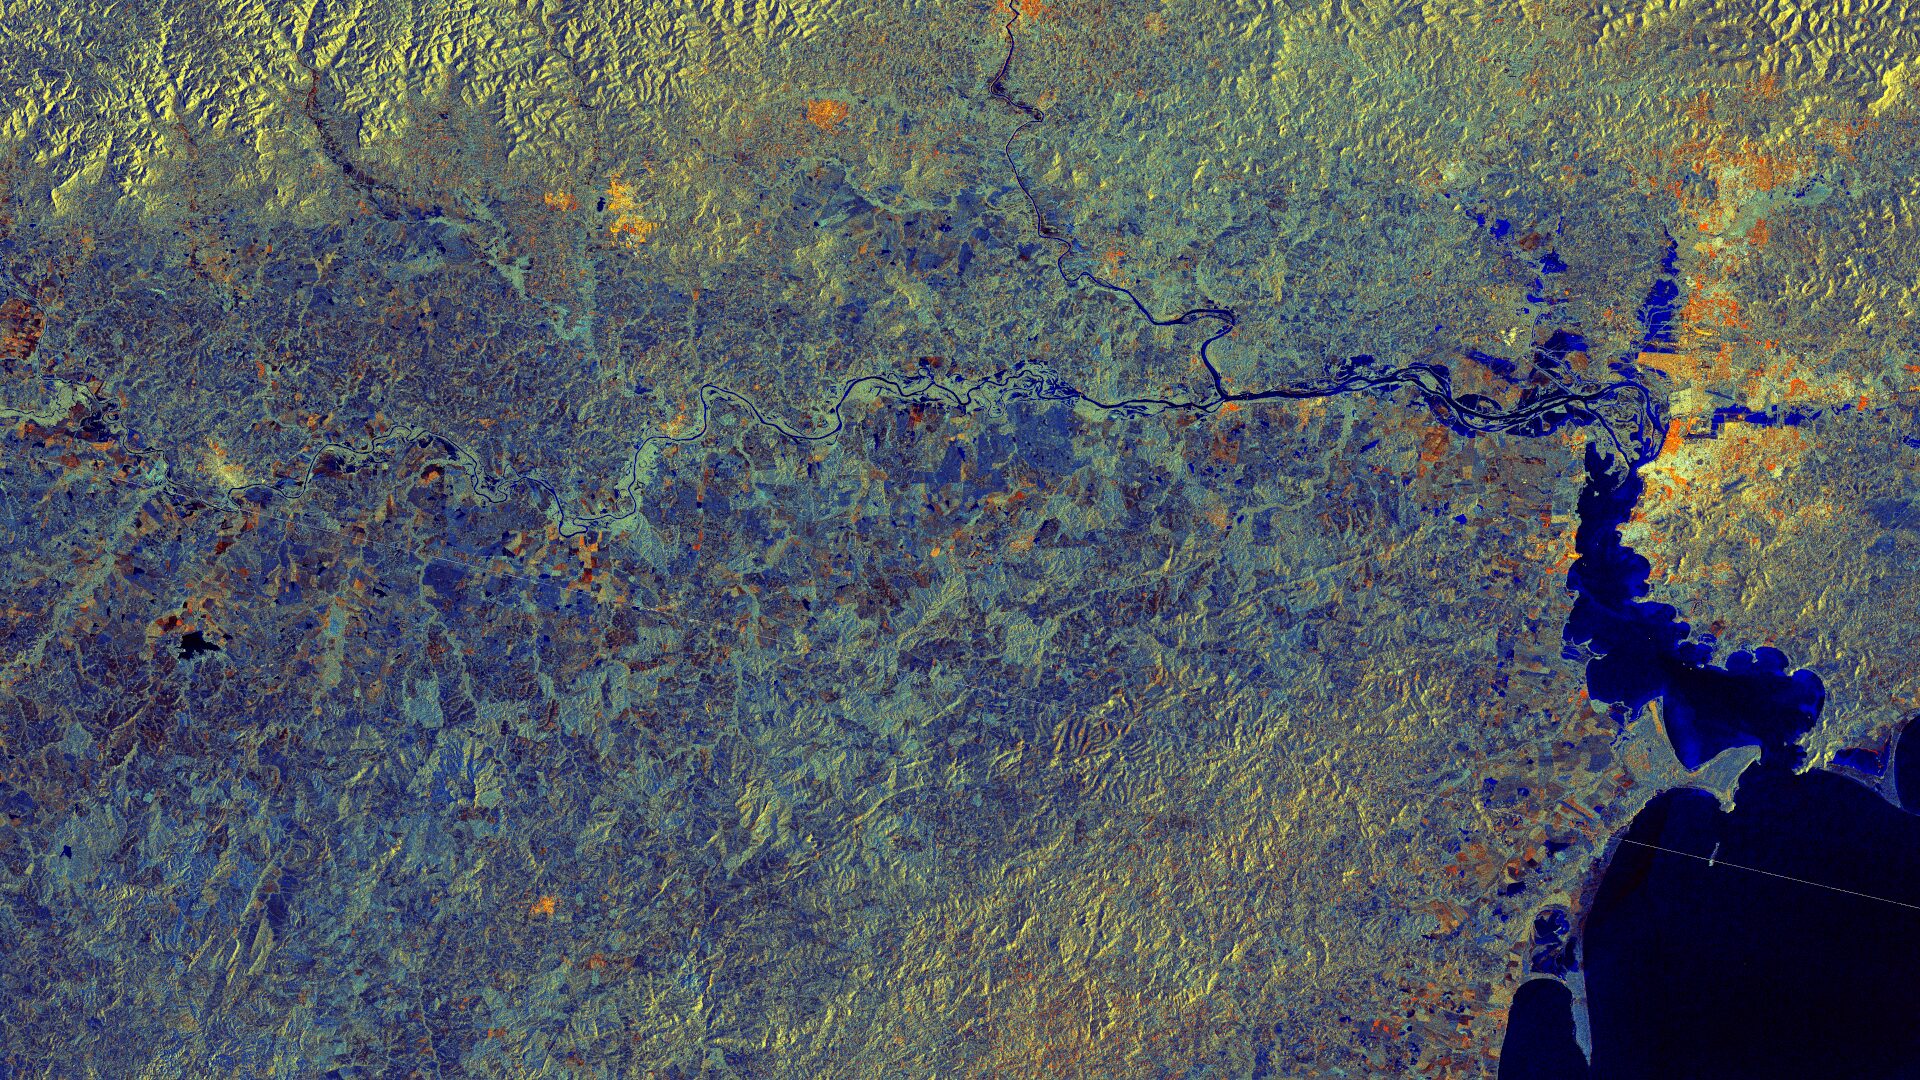
Rio Grande do Sul – Brazil, captured by the Sentinel-1A satellite on May 11, 2024, and June 4, 2024.
The satellite image of the month March is the third part of our twelve-part visual journey. It concludes the thematic block “Acute hazards – visible from space”, which deals with natural hazards, their visible impacts and the possibilities of satellite-based analysis.
The image shows part of the Brazilian state of Rio Grande do Sul in southern Brazil. For the first time, we have selected an image based on synthetic aperture radar (SAR) data. A composite of the VV and VH polarisation bands from the Sentinel-1A satellite was used for the image. Detailed information on satellite image processing and the Sentinel-1 composite used can be found here.
Structure of the image
In the image section, the Jacuí river can be seen as a blue band. It runs from west to east and flows into Guaíba lake near the city of Porto Alegre, which can be seen in bright yellow and red tones on the right-hand side of the image. Lago Guaíba eventually flows into the much larger Lagoa dos Patos lagoon, which can be seen in the lower right corner of the image. Lagoa dos Patos is connected to the Atlantic Ocean.
Flood 2024
In April and May 2024, the region experienced severe flooding. It was caused by exceptionally heavy and prolonged rainfall and ranks among the most severe natural disasters in the history of Brazil. The Jacuí river catchment area was particularly affected, with the greatly increased runoff transporting large amounts of water into Guaíba lake. This caused the water level of the lake to rise, leading to widespread flooding in the metropolitan area. The flood caused extensive damage to infrastructure, residential areas and agricultural land throughout the region. It also resulted in at least 180 deaths.
A comparison of the two Sentinel-1 images, taken during the flood and a few weeks later, clearly shows the extent of the flooding along the Jacuí river.
Analyzing using Satellite Data
As already shown in the two previous satellite images of the month, comparing before and after images is a common method of analysing natural events using satellite and aerial image data. SAR data, as provided by Sentinel-1, is independent of cloud cover and is therefore particularly well suited as a supplement to the optical satellite data shown so far.
As part of the VALE project, we at mundialis developed a method for flood analysis using Sentinel-1 data. This method allows to automatically identify flooded areas and aggregate them over a year. By analysing all images from a year, flood hazard maps can be created which, in combination with other geodata (e.g. population or land use), can be used for risk analysis.
A different view of the region
The following animations show an overlay with OSM data. The map visualization was created using the terrestris OpenStreetMap service.
Outlook
In the next thematic section, we will focus on changes that occur rather slowly, often over many years. Satellite data makes these ‘traces of time’ visible and shows how landscapes and cities are changing. In that way even subtle surface changes can be observed, measured and analysed from space.
Contains modified Copernicus Sentinel data (2024)/ESA – created by mundialis
Satellite images for your wall are available at https://art-from-space.de