
Today it is common practice for everyone to take pictures with digital cameras or mobile phones. When photographing people they are usually not more than a few meters away while landscape pictures might have a range of a few hundred meters or a couple of kilometers at the most. Given this scope of personal experience it is quite astounding to think about satellites flying in space at an altitude of several hundred or even thousands of kilometers taking very detailed pictures of the Earth. Well, this is what is happening since 2015 in the context of a programme financed by the European Union called Copernicus.
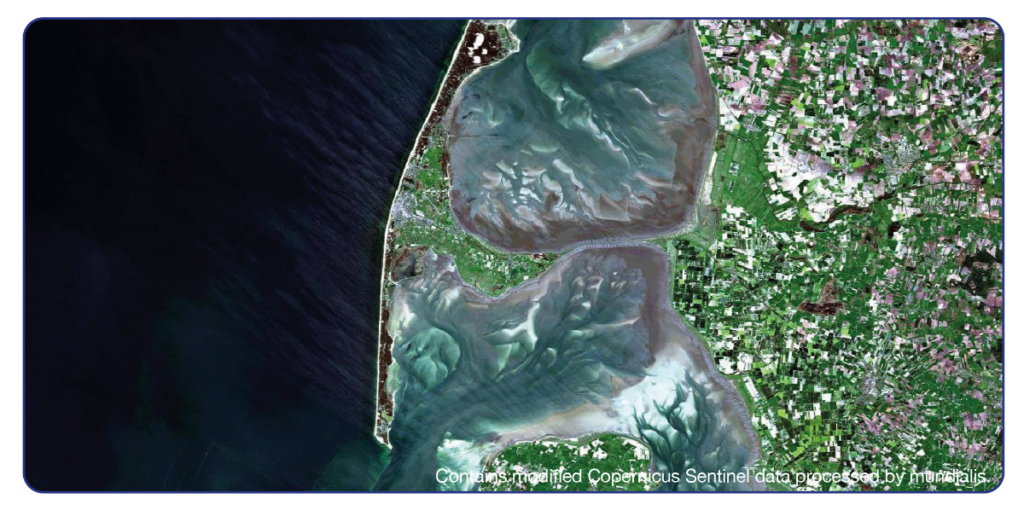
There is of course a longer history of satellites orbiting the Earth and observing it with different sensors. The unique characteristic of the Copernicus Programme however is the unprecedented temporal and spatial resolution of the data. Depending on the location on Earth a new image is generated about once a week with a spatial resolution of 10 meters. The fact that the data is made available to the general public for free is another and equally exciting aspect.
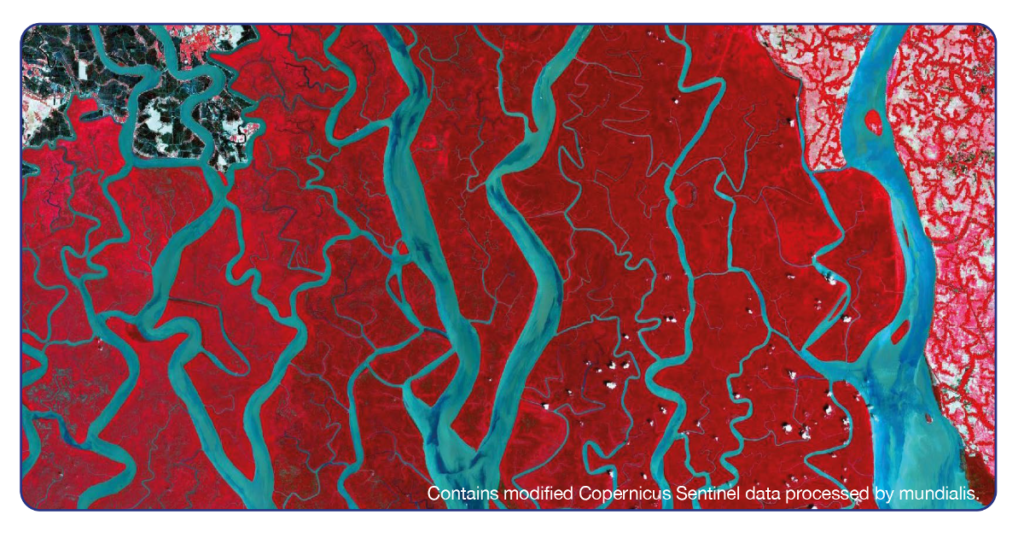
The satellites of the Copernicus Programme are called Sentinels and they come in pairs of two. Sentinel-1 is an all-weather RADAR satellite while Sentinel-2 carries a multispectral camera. Sentinel-3 is dedicated to sea-surface topography and sea- and land temperature measurements while – in the near future – Sentinel-4 will monitor the composition of the atmosphere. Sentinel-5 will also monitor atmospheric composition while Sentinel-6 is dedicated to high precision sea level measurements. Some of the satellites mentioned above will be launched in the next couple of years. The data originating from the satellites can be used for any number of purposes. One of these is ecosystem restoration. To this end HERMOSA has built-in automated access to the archives of the Copernicus Programme and can currently utilize data from Sentinel-1 and Sentinel-2. For a user of HERMOSA the work-flow is very easy:
- Define the area you are interested in by drawing a bounding box on the map
- Select the time from which you would like to have the data – you can go back as far as 2015
- Define the amount of cloud-cover you are prepared to accept in the images
Once you press the ‘run’ button data gets downloaded automatically from the Copernicus archive and is then processed on the HERMOSA platform. After the processing has finished the map is delivered automatically to the layer tree where it can be inspected and viewed in context with other spatial data. HERMOSA automatically calculates geo-statistical values for each processed image so that change between two points in time can easily be quantified. The change is also visualized in appropriate maps. The opportunities this offers are virtually endless.
Besides the Copernicus Programme there are of course numerous other data sources made available in HERMOSA which can complement each other. The user thus has easy access to information generated from Earth observation data and is empowered to monitor progress of projects located anywhere on the globe.
Contact sales@hermosa.earth today to get started!
reposted from https://hermosa.mundialis.de/news/feature-of-the-week-kw-15/