
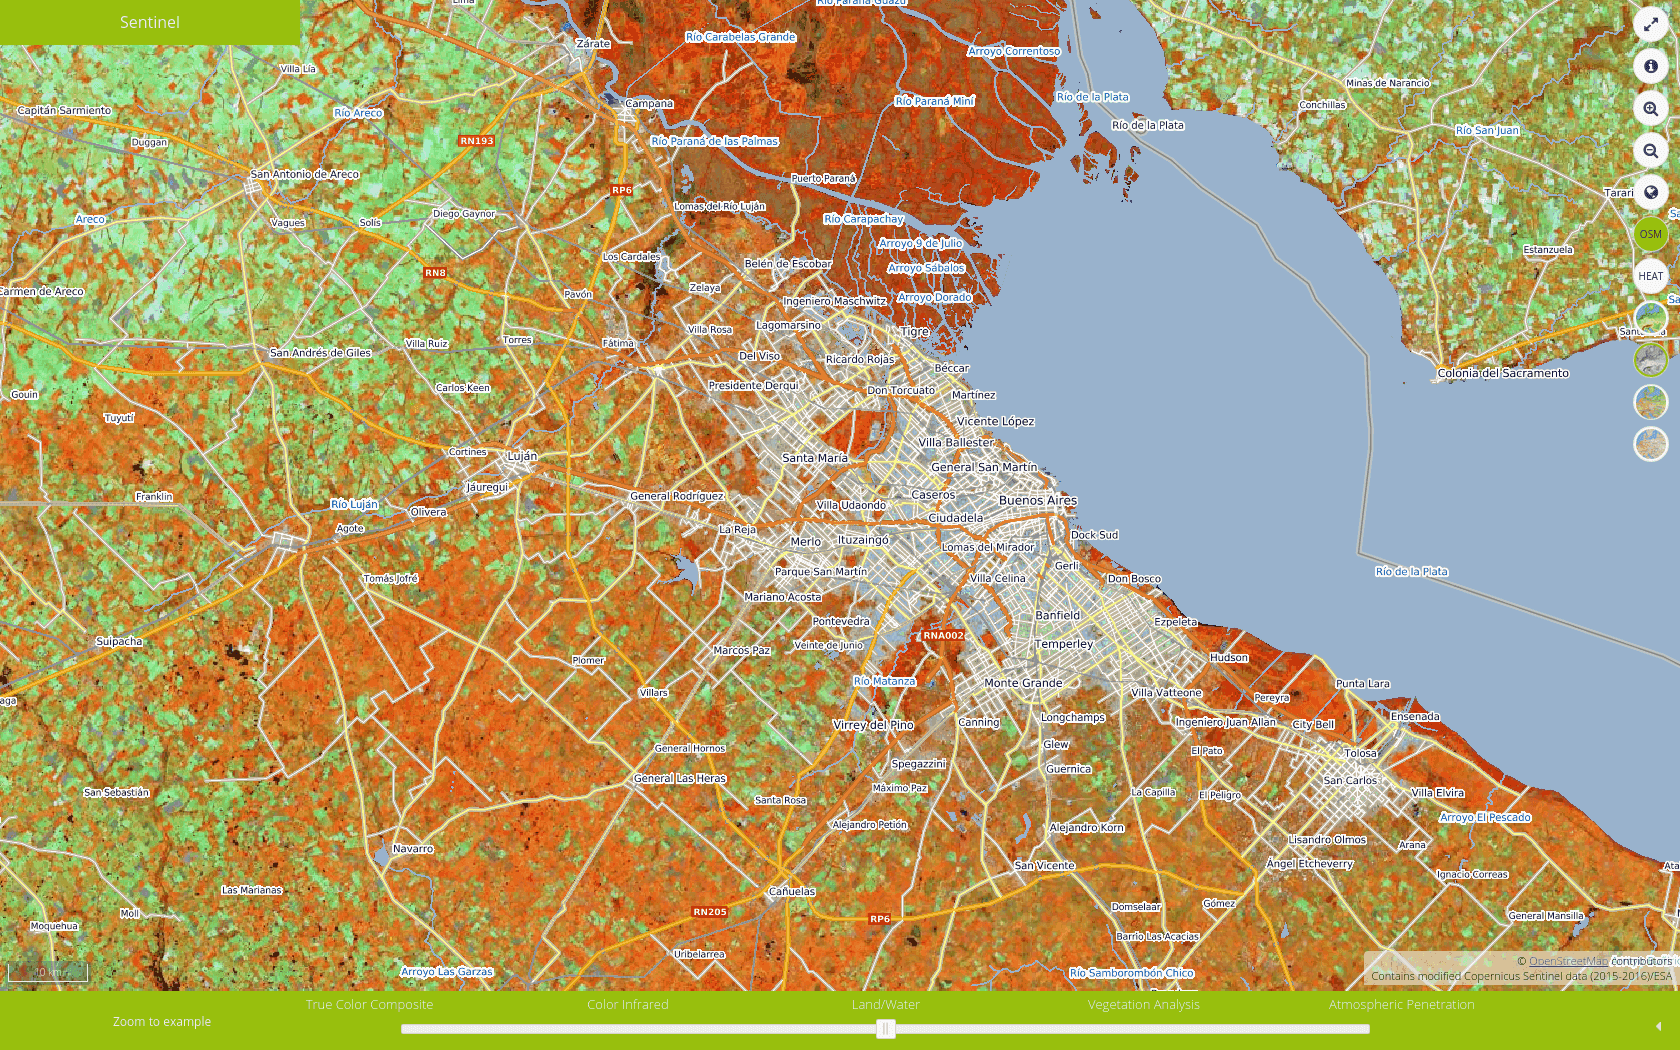
Experience our new mundialis web application in which we present Sentinel 2A satellite data from the Copernicus programme. In this post we explain what you can do with it. It contains a preview layer with which you can filter and find raw Sentinel 2A data or order processed scenes, a “heatmap” to get an overview of the places where the most sentinel 2A data is available and a slider with which you can slide through different readily processed composites. To see all this in action, click on the image below or read further to see how this was done and how to serve the client.
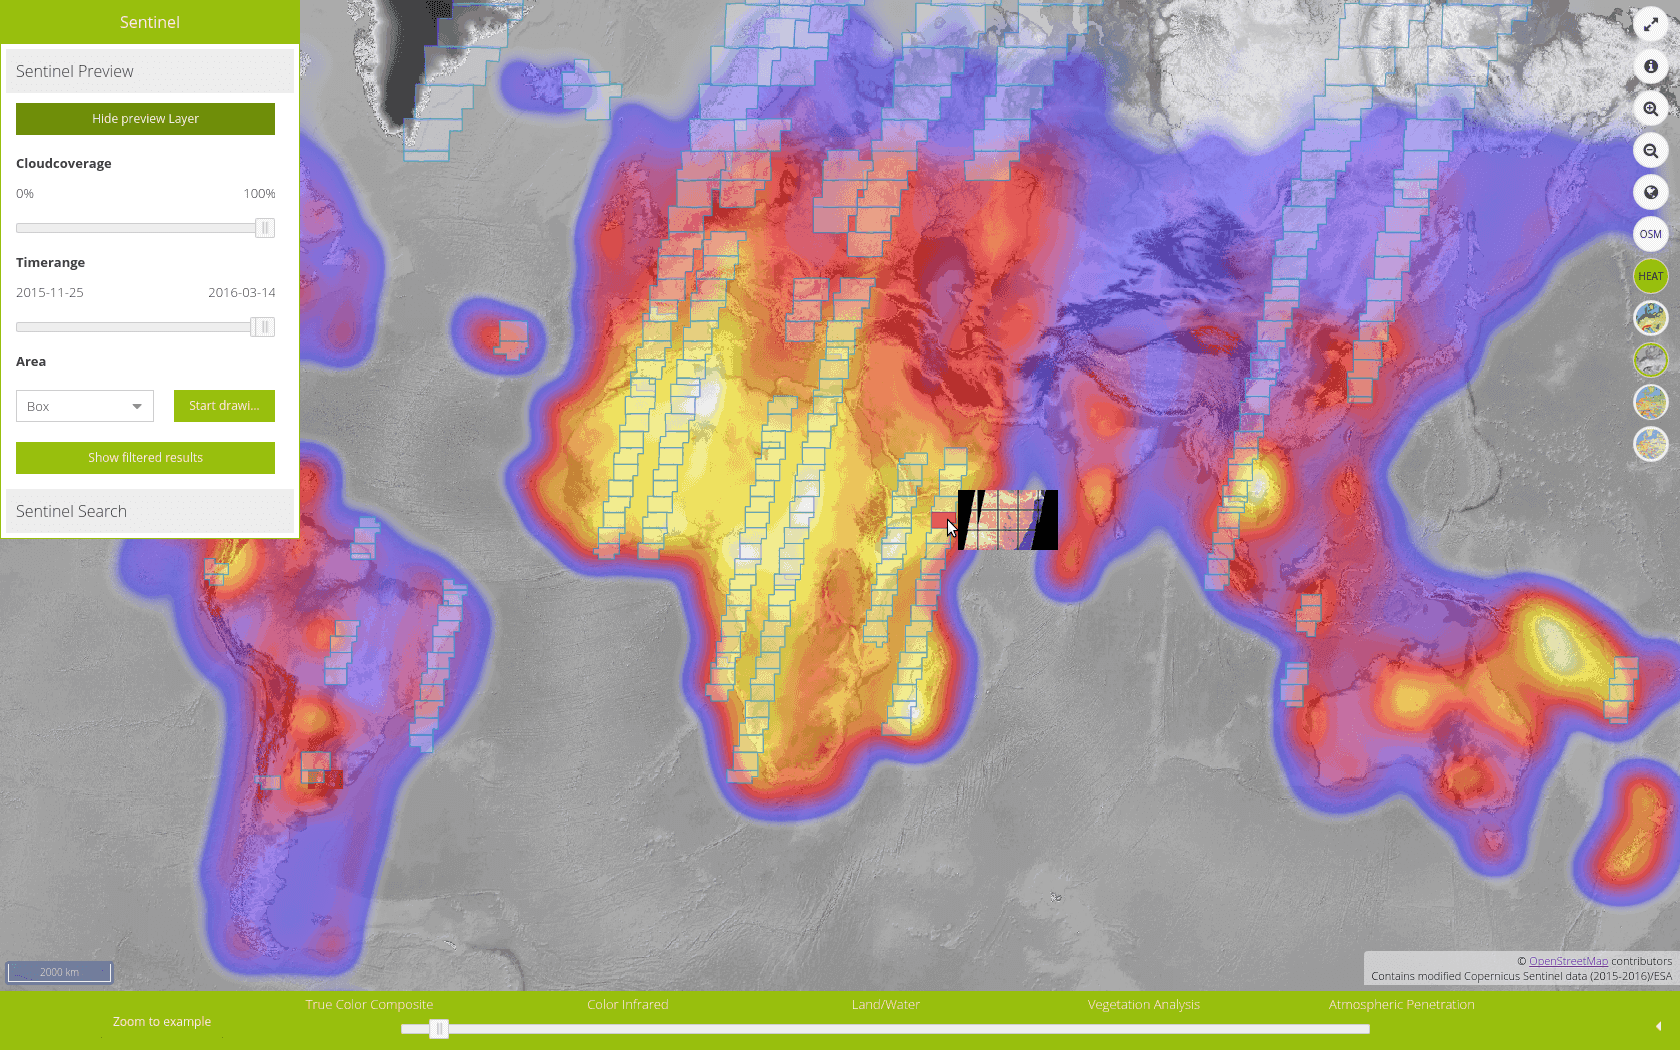
As you can see in the image, there are different components which are explained in detail below. The client is based on the javascript frameworks Ext JS 6, OpenLayers 3, GeoExt 3 and BasiGX, which are all open source software and free to use. The client receives its data from two different geoservers – from ows.mundialis.de/services/service? , which you might already know from our free topography and OSM web service and from geoserver.mundialis.de/geoserver/ows? which contains the Sentinel data. Details about the layers is given in the suitable sections below.
- 1. Sentinel Toolbar with Preview Layer and Processing tasks
- 2. Map Toolbar with heatmap layer and background layers
- 3. Composite slider
1. Sentinel Toolbar with Preview Layer and Processing tasks
The Preview Layer
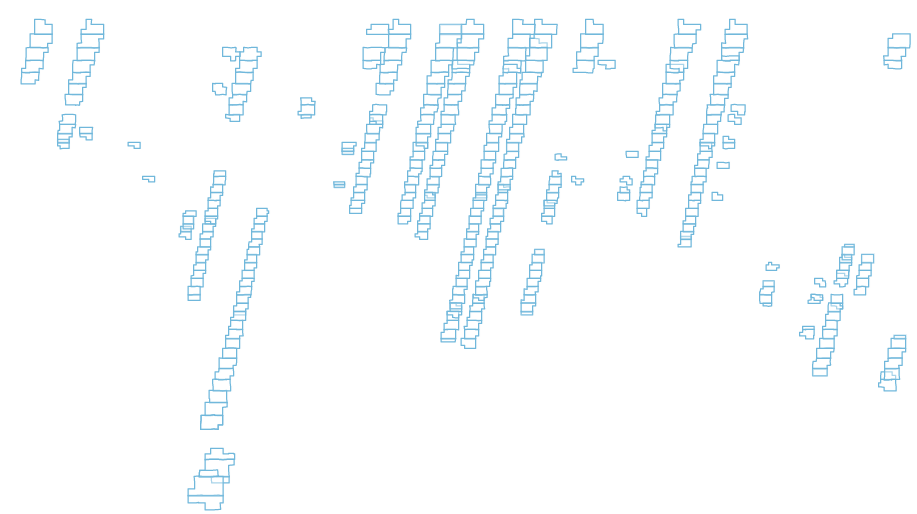
This layer shows all currently available footprints of Sentinel 2A data. It is a Web Map Service published via Geoserver. It is build by using the API from ESA for Sentinel data. By requesting this API the answer includes information about available data with observation time, cloud coverage, file size, unique ID, location and preview image. This information is extracted and stored in a PostGIS database, which Geoserver uses for the WMS. The API is requested every day, so that the layer is up to date.
It uses view parameters which are additional URL parameters you can add to the WMS to filter information. These are start and end date to find data within specific time ranges and cloud coverage in percentage to filter out sentinel scenes with too much clouds. These parameters can be controlled with the Sentinel toolbar described below.
The Sentinel Preview Toolbar
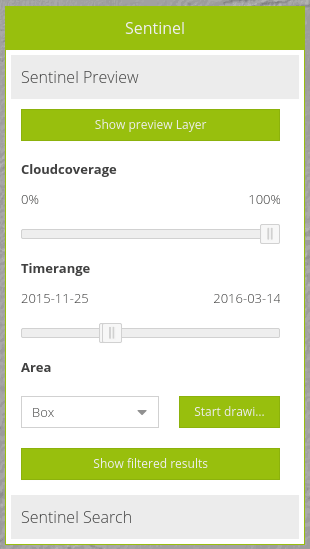
With the Sentinel Preview Toolbar it is possible to control which footprints of the preview layer you would like to see. The above mentioned view parameters can be defined here.
The first setting can be done with a slider to adjust the maximum of cloud coverage. If you choose 0% you will only find cloud free data. If you choose 100% you will get all available data ranging from cloud free images up to images full of clouds. With this slider you can set the value with which you are confident.
The second slider controls the time range. You can set a start and end date and see all available data that was obtained within this time range. When you select a range of only one or two days, you will see which way the sentinel satellite took to record data. Depending on the time range it might happen that there is more than one footprint available at the same place. Then all of them will be displayed on the map.
The last setting which helps to choose data is the area of interest. You can choose between boxes, points and others. Then start drawing your area on the map and only the footprints will be shown which are contained in the region you just drawn.
Below these settings there is the button “Show filtered results“. When clicking this button a window will open and you’ll see a collection of all preview images from the footprints you see on the map.
By default the preview layer is visible on the map. In this toolbar there is also a button to switch it off.
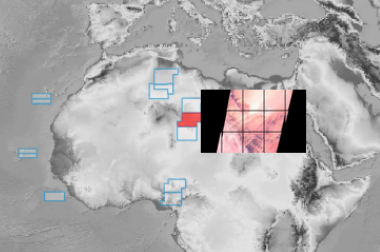
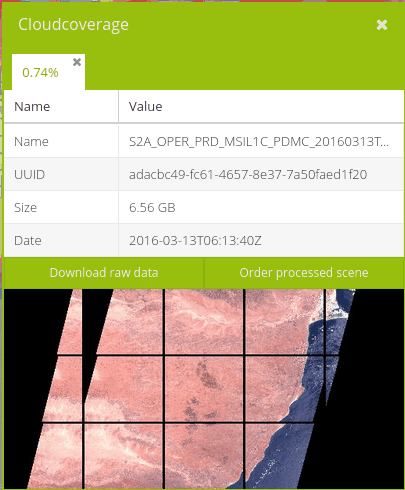
Preview Image and Feature Information
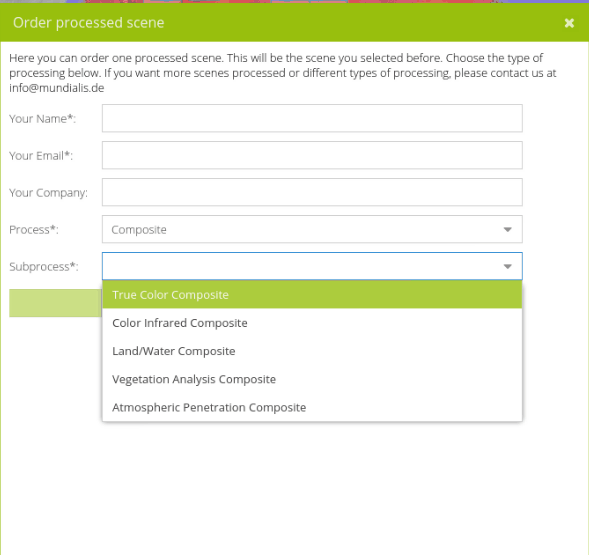
When you have chosen your area of interest, allowed cloud coverage and time range, you can see all available footprints that fit your selection on the map. When you hover over one footprint, you can see the respective preview image and get an impression of how this scene will look like. When you click on it you will get more detailed information about the scene. From here you can download the raw data from ESA or you can order a processed scene. At the moment it is possible to order different kinds of composites, for example true color composites or false color composites and also to calculate predefined indices, e.g. NDVI, NDWI and other derived products from the scene you selected. We want to extend our offers continuously.
When you click “Submit” your job will be added to our queue. When processing starts, at first the data will be downloaded from ESA. Then out of the raw data the atmospheric corrected data will be calculated with sen2cor. Afterwards the corrected data will be processed further with GRASS GIS and GDAL to calculate the composites and later the different indexes. In the last step the new product will be published as WMS and you will receive an email about where to find your ordered processed scene. As the processing is consuming resources of different kinds, you can order only two scenes for free. If you are interested in a larger area or in different calculations of one area please contact us by email or web form.
The Sentinel Search Toolbar
With the Sentinel Search Toolbar it is easy to find a Sentinel Scene via its unique ID (UUID) or its name. To choose suitable Sentinel data you would use the Sentinel Preview Toolbar, but if you already know the UUID or name of a scene and want an immediate look you can find it with this search easily. Hovering and Feature Information are available the same way as described above. Downloading and ordering a calculated product is possible as well.
2. Map Toolbar with heatmap layer and background layers

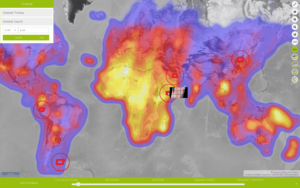
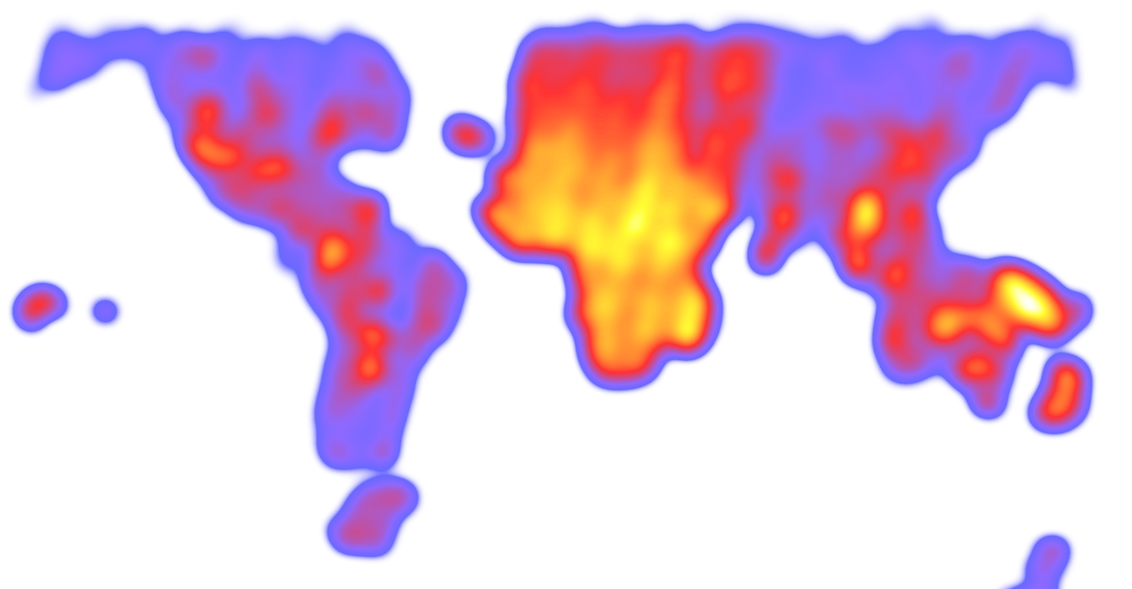
This toolbar helps you to control map settings. By default one background layer and the heatmap is visible. With this toolbar you can switch the background and turn the heatmap off. To switch the background simply choose one of the buttons with a map image on it. At the moment there are four different layers available about which you can find out more here. With the buttons above you can make certain layers visible. One of them is the Sentinel Heatmap. It highlights the areas where Sentinel 2A data exists. Yellow to white colors mean that there is a lot of data available. The more the colors turn to purple, the less data is available. This layer has the same source than the preview layer described above but a different style and no filtering is applied. By using the same source we make sure that both are updated every day.
Another layer to switch on or off via the map toolbar is the OSM overlay layer. It is very useful when looking at a processed remote sensing image and wanting to get information about the exact location.
Above the buttons with which you can make certain layers visible, there are some map tools like zooming in and out and showing the overview map. Another useful tool for looking at remote sensing images is the fullscreen button which hides all menu items of the screen so that the view is cleared for the map.
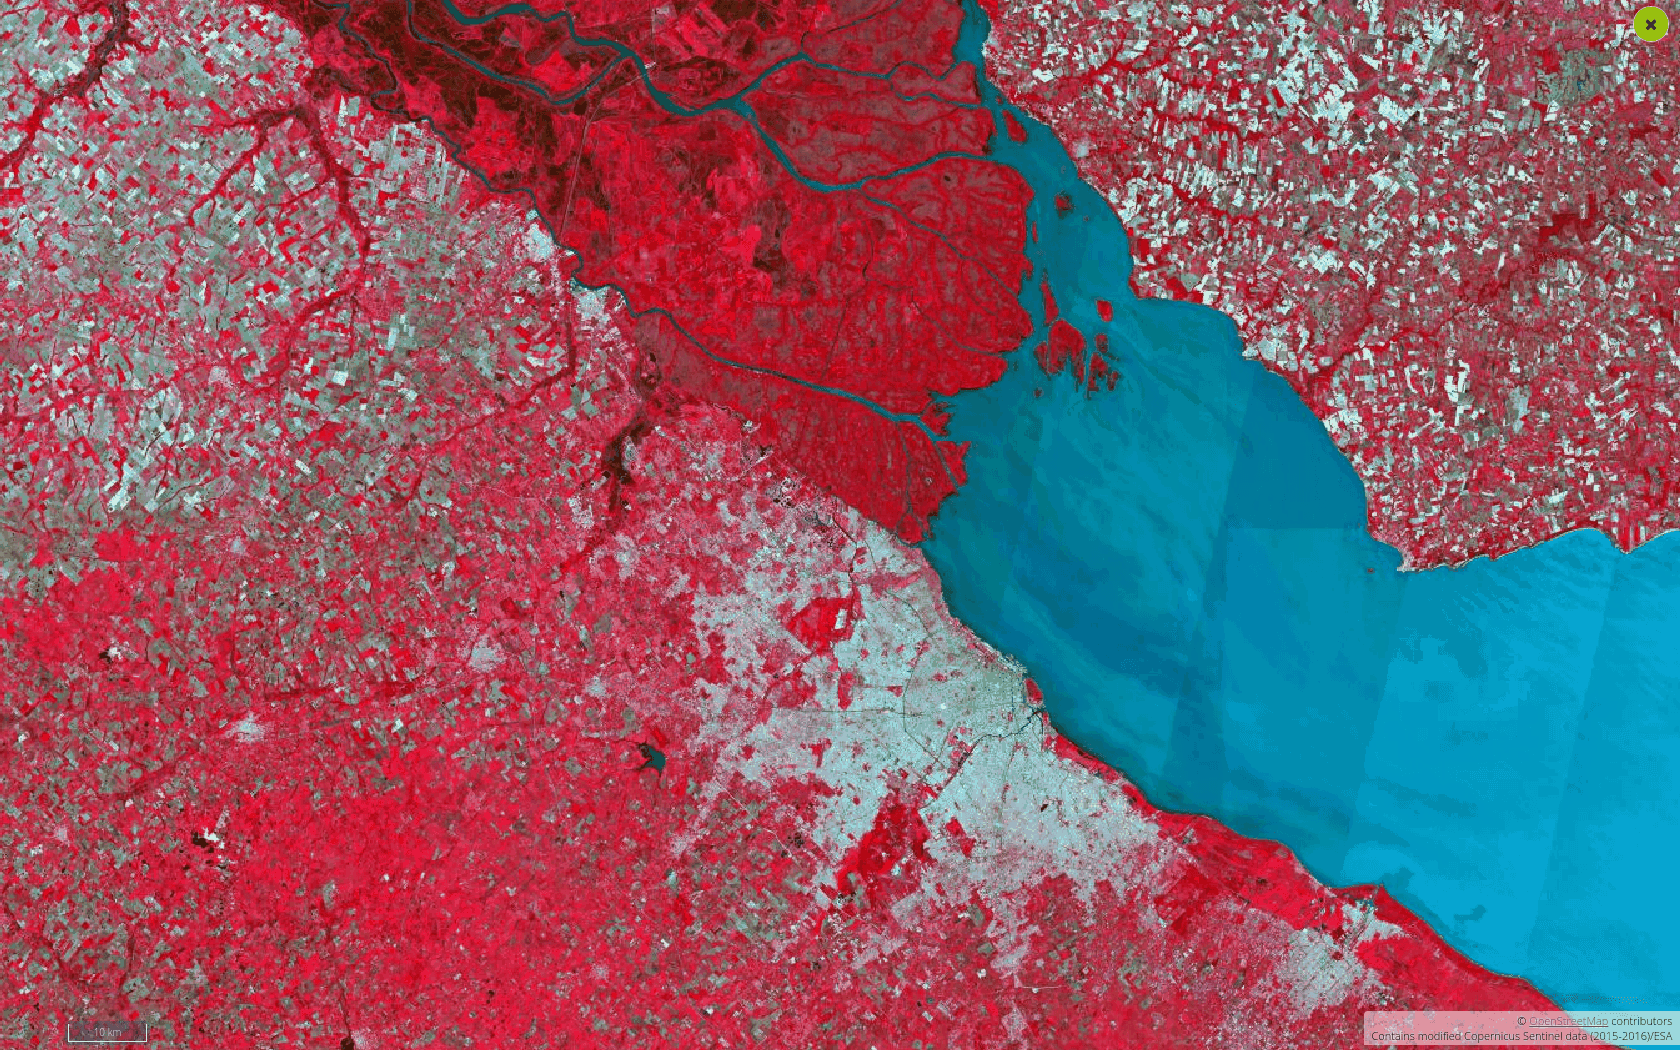
3. Composite slider

The composite slider shows examples of different processed composites. When clicking the button “Zoom to example” the map view pans to a Sentinel 2A scene where certain composites were already calculated. Now they can be viewed by sliding through the composite slider.
Now that you read so much about it, try it!