
Last week we already spoke about how the HERMOSA platform relies on the successful Copernicus programme operated by the European Commission and managed by the European Space Agency (ESA). We also mentioned that the satellites called Sentinels collect data at high temporal and spatial resolutions and that this data is made available for free to everyone.
When considering the sensors on these satellites they all measure the electromagnetic spectrum, of which some range is visible to the human eye. Electromagnetic radiation is energy which can take on many forms and is, in principle, defined by its wavelength. When the Sun illuminates the Earth, electromagnetic radiation is reflected back into space, letting multispectral optical sensors collect imagery. This is a passive process because the sensor simply detects energy emitted from somewhere else. In contrast, the socalled RADAR satellites use their own energy source and emit radiation which gets echoed back from the Earth. This is an active process and therefore mainly unaffected by clouds (which is not the case with aforementioned optical sensors). If you are interested in the nitty-gritty of the technology you are welcome to check out this resource.
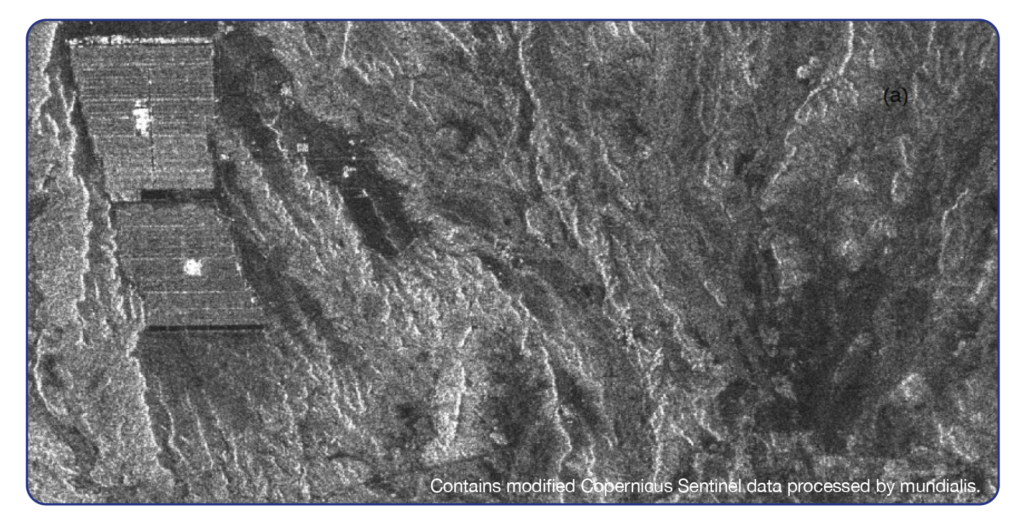
As with the other Copernicus satellites, also Sentinel-1 comes as a pair. They are flying in the same orbit but 180° apart. This means that if Sentinel-1a is above the north pole then Sentinel-1b is above the south pole and vice versa. This constellation enables the high temporal resolution of the data with a revisit time of approximately 5 days for any spot on Earth. Since Sentinel-1 is an active instrument it sends out microwave signals which are reflected from Earth and measured by the RADAR instrument. Depending on the surface structure and composition, i. e. forests, towns, rivers, lakes, fields, mountains etc. the signal is modified and contains specific information relating to the surface elements. In the HERMOSA platform RADAR data from one area but two different dates is analysed. The process is very similar to the way Sentinel-2 is accessed in the platform:
- The user draws a bounding box on the map to mark the area of interest and chooses two different image acquisition dates.
- HERMOSA then accesses the Sentinel-1 archive and retrieves the relevant satellite scenes which are in turn processed by actinia, our open source geoprocessing engine based on GRASS GIS.
- Once the computing is finished a map gets delivered to the layer tree for visual inspection, further calculations or to be exported.
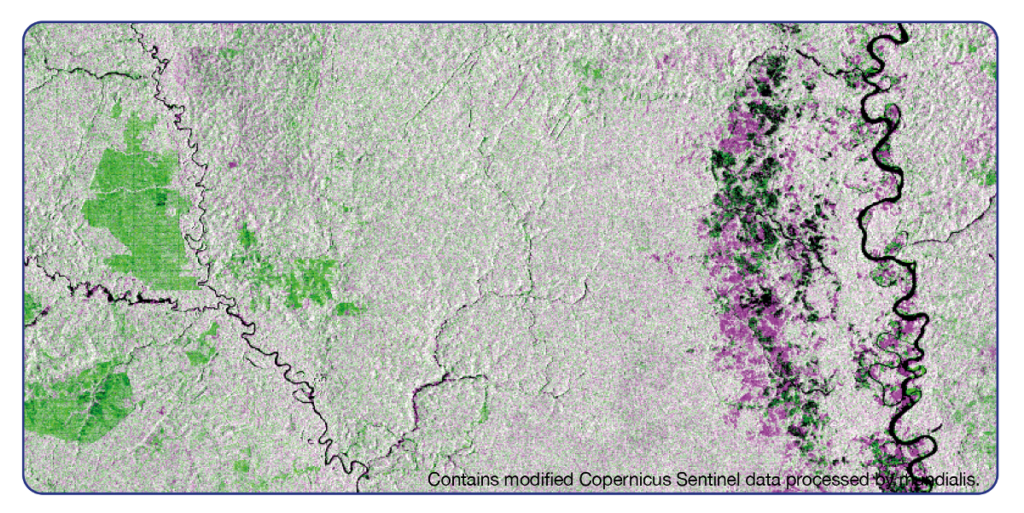
The maps are sometimes difficult to interpret but not so in HERMOSA. Pink colours stand for signal loss and green colours for signal gain. When observing a tropical rainforest for example areas in pink are the ones where forest was lost, while the green areas show (re)growth of forest for the timespan in question.
Contact sales@hermosa.earth today to get started!
reposted from https://hermosa.mundialis.de/news/feature-of-the-week-kw-17/